Skews and observation of box plot


Correlation
Correlation defines a relationship between two independent variables. It tells the degree to which variables move in relation to each other. When two sets of data are related to each other, there is a correlation between them.
Linear Correlation
A correlation is used to determine the relationships between numerical and categorical variables. In other words, it is an indicator of how things are connected to one another. The correlation analysis is the study of how variables are related.
Regression Analysis
Regression analysis is a statistical method in which it estimates the relationship between a dependent variable and one or more independent variable. In simple terms dependent variable is called as outcome variable and independent variable is called as predictors. Regression analysis is one of the methods to find the trends in data. The independent variable used in Regression analysis is named Predictor variable. It offers data of an associated dependent variable regarding a particular outcome.
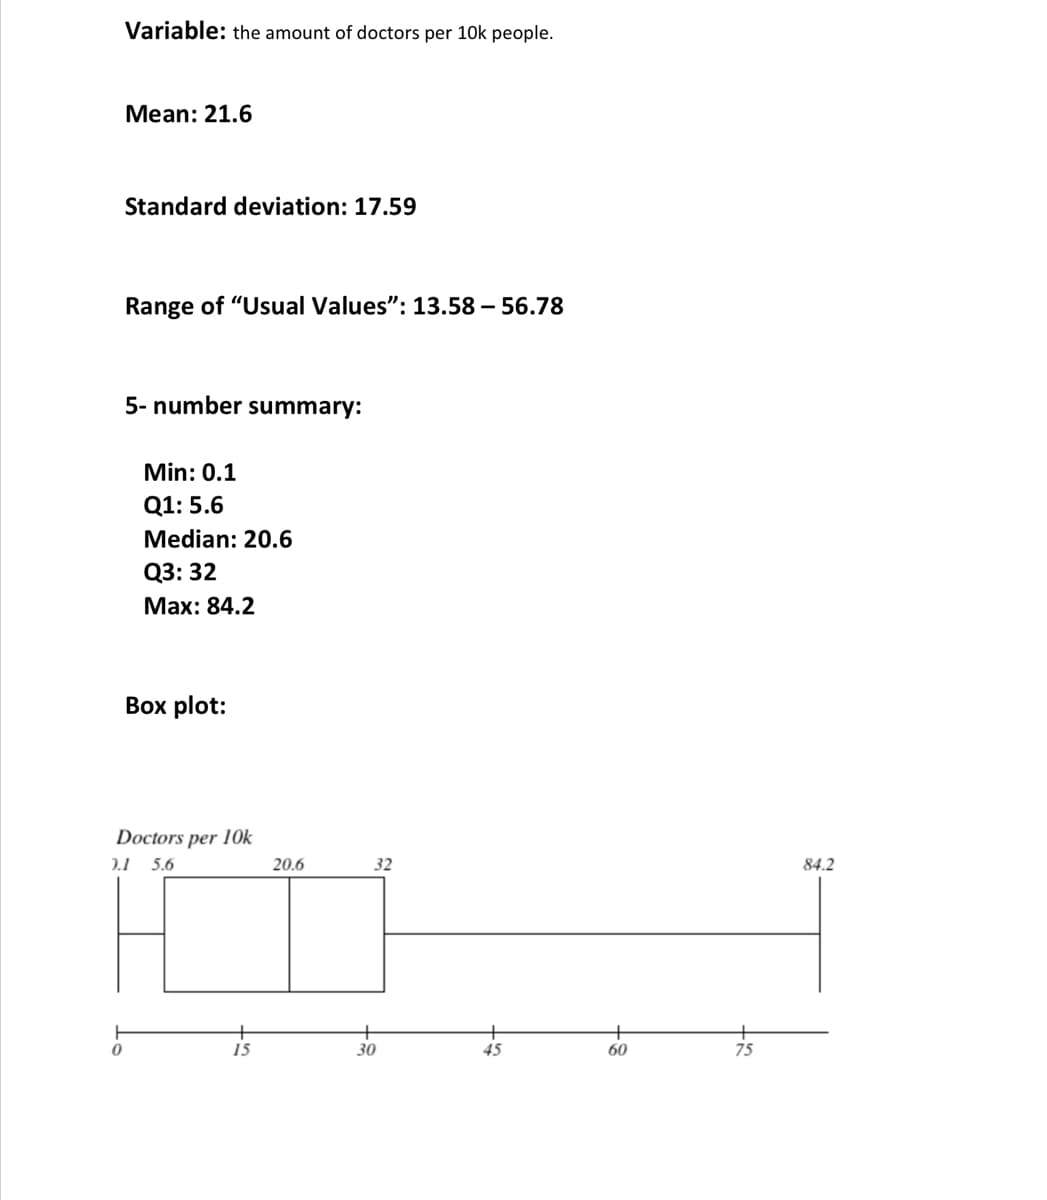
Boxplot:
Boxplot is the simple way to plot the observations of the distribution, with five-number summary of order, minimum, first quartile , median , third quartile , maximum. The boxplot can be used for determining whether the shape of the distribution is symmetric or skewed.
In the boxplot, border line towards the left side (bottom) of the box represents the value of first quartile. The median is the middle value of the data set. In the boxplot, the line in middle of the box represents median of the dataset. The border line towards the right side (top) of the box represents the value of third quartile. The point from where the lower whisker (left) starts is the minimum value and the point where the upper whisker (right) ends is the maximum value
Shape of distribution using boxplot:
The distribution of data would be positively skewed (skewed right) when the center line (median) is closer to the left side (lower end) of the box.
The distribution of data would be negatively skewed (skewed left) when the center line (median) is closer to the right side (upper end) of the box.
The distribution of data would be symmetric when the center line (median) is at the center of box. The median divides the boxplot into to equal parts.

Step by step
Solved in 2 steps


