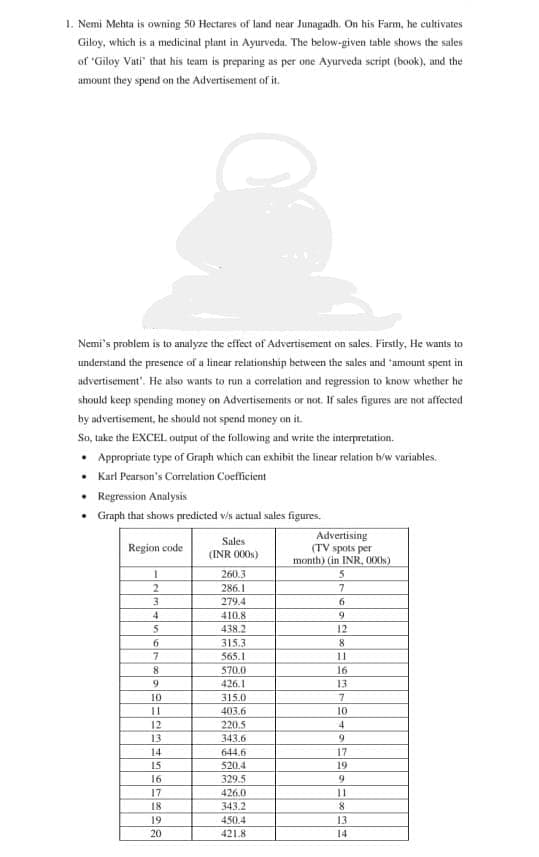
So, take the EXCEL output of the following and write the interpretation. • Appropriate type of Graph which can exhibit the linear relation b/w variables. • Karl Pearson's Correlation Coefficient • Regression Analysis Graph that shows predicted vis actual sales figures.

Linear Algebra: A Modern Introduction
4th Edition
ISBN:9781285463247
Author:David Poole
Publisher:David Poole
Chapter2: Systems Of Linear Equations
Section2.4: Applications
Problem 28EQ
icon
Related questions
icon
Concept explainers
Question
1. Nemi Mehta is owning 50 Hectares of land near Junagadh, On his Farm, he cultivates
Giloy, which is a medicinal plant in Ayurveda. The below-given table shows the sales
of "Giloy Vati" that his team is preparing as per one Ayurveda script (book), and the
amount they spend on the Advertisement of it.
Nemi's problem is to analyze the effect of Advertisement on sales. Firstly, He wants to
understand the presence of a linear relationship between the sales and 'amount spent in
advertisement". He also wants to run a correlation and regression to know whether he
should keep spending money on Advertisements or not. If sales figures are not affected
by advertisement, he should not spend money an it.
So, take the EXCEL output of the following and write the interpretation.
• Appropriate type of Graph which can exhibit the linear relation b/w variables.
Karl Pearson's Correlation Coefficient
• Regresion Analysis
Graph that shows predicted vis actual sales figures.
Advertising
(TV spots per
month) (in INR. 000s)
5.
Sales
(INR 000s)
Region code
260.3
286.1
279.4
3.
6.
410.8
438.2
12
315.3
7.
565.1
11
8
570.0
16
9
426.1
13
10
315.0
7.
11
403.6
10
12
220.5
13
343.6
9
14
644.6
17
15
520.4
329.5
19
16
426.0
17
18
11
343.2
8.
19
450.4
13
20
421.8
14
Transcribed Image Text:1. Nemi Mehta is owning 50 Hectares of land near Junagadh, On his Farm, he cultivates Giloy, which is a medicinal plant in Ayurveda. The below-given table shows the sales of "Giloy Vati" that his team is preparing as per one Ayurveda script (book), and the amount they spend on the Advertisement of it. Nemi's problem is to analyze the effect of Advertisement on sales. Firstly, He wants to understand the presence of a linear relationship between the sales and 'amount spent in advertisement". He also wants to run a correlation and regression to know whether he should keep spending money on Advertisements or not. If sales figures are not affected by advertisement, he should not spend money an it. So, take the EXCEL output of the following and write the interpretation. • Appropriate type of Graph which can exhibit the linear relation b/w variables. Karl Pearson's Correlation Coefficient • Regresion Analysis Graph that shows predicted vis actual sales figures. Advertising (TV spots per month) (in INR. 000s) 5. Sales (INR 000s) Region code 260.3 286.1 279.4 3. 6. 410.8 438.2 12 315.3 7. 565.1 11 8 570.0 16 9 426.1 13 10 315.0 7. 11 403.6 10 12 220.5 13 343.6 9 14 644.6 17 15 520.4 329.5 19 16 426.0 17 18 11 343.2 8. 19 450.4 13 20 421.8 14
Expert Solution
steps

Step by step

Solved in 6 steps with 6 images

Blurred answer
Knowledge Booster
Correlation, Regression, and Association
Learn more about
Need a deep-dive on the concept behind this application? Look no further. Learn more about this topic, statistics and related others by exploring similar questions and additional content below.
Recommended textbooks for you
Linear Algebra: A Modern Introduction
Algebra
ISBN:
9781285463247
Author:
David Poole
Publisher:
Cengage Learning
Glencoe Algebra 1, Student Edition, 9780079039897…
Algebra
ISBN:
9780079039897
Author:
Carter
Publisher:
McGraw Hill