solve the following problem in excel, step-by-step, in pictures (making the graphs)

Glencoe Algebra 1, Student Edition, 9780079039897, 0079039898, 2018
18th Edition
ISBN:9780079039897
Author:Carter
Publisher:Carter
Chapter10: Statistics
Section10.1: Measures Of Center
Problem 9PPS

Related questions
Question
solve the following problem in excel, step-by-step, in pictures (making the graphs)
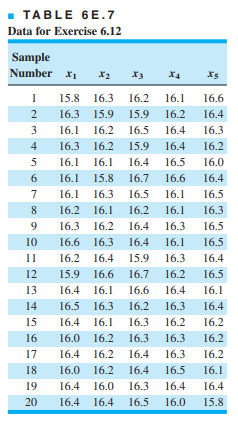
Transcribed Image Text:TABLE 6E.7
Data for Exercise 6.12
Sample
Number x1
X4
15.8 16.3 16.2
16.1
16.6
2
16.3 15.9
15.9
16.2
16.4
3
16.1 16.2
16.5
16.4
16.3
4
16.3 16.2
15.9
16.4
16.2
5
16.1 16.1
16.4
16.5
16.0
6
16.1 15.8
16.7
16.6
16.4
7
16.1 16.3
16.5
16.1
16.5
8
16.2 16.1
16.2
16.1
16.3
9.
16.3 16.2
16.4
16.3
16.5
10
16.6 16.3
16.4
16.1
16.5
11
16.2 16.4
15.9
16.3
16.4
12
15.9 16.6
16.7
16.2
16.5
13
16.4 16.1
16.6
16.4
16.1
14
16.5 16.3
16.2
16.3
16.4
15
16.4 16.1 16.3
16.2
16.2
16
16.0 16.2
16.3
16.3
16.2
17
16.4 16.2
16.4
16.3
16.2
18
16.0 16.2
16.4
16.5
16.1
19
16.4 16.0
16.3
16.4
16.4
20
16.4 16.4
16.5
16.0
15.8
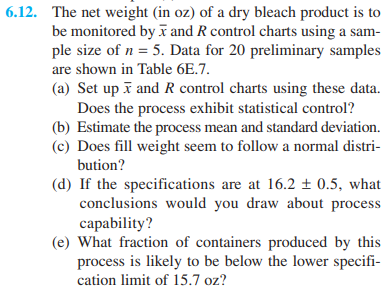
Transcribed Image Text:6.12. The net weight (in oz) of a dry bleach product is to
be monitored by ī and R control charts using a sam-
ple size of n = 5. Data for 20 preliminary samples
are shown in Table 6E.7.
(a) Set up ī and R control charts using these data.
Does the process exhibit statistical control?
(b) Estimate the process mean and standard deviation.
(c) Does fill weight seem to follow a normal distri-
bution?
(d) If the specifications are at 16.2 ± 0.5, what
conclusions would you draw about process
capability?
(e) What fraction of containers produced by this
process is likely to be below the lower specifi-
cation limit of 15.7 oz?
Expert Solution
This question has been solved!
Explore an expertly crafted, step-by-step solution for a thorough understanding of key concepts.

Step by step
Solved in 2 steps with 17 images

Recommended textbooks for you
Glencoe Algebra 1, Student Edition, 9780079039897…
Algebra
ISBN:
9780079039897
Author:
Carter
Publisher:
McGraw Hill

Linear Algebra: A Modern Introduction
Algebra
ISBN:
9781285463247
Author:
David Poole
Publisher:
Cengage Learning
Glencoe Algebra 1, Student Edition, 9780079039897…
Algebra
ISBN:
9780079039897
Author:
Carter
Publisher:
McGraw Hill
Linear Algebra: A Modern Introduction
Algebra
ISBN:
9781285463247
Author:
David Poole
Publisher:
Cengage Learning