Solve the following problems about Risks and Odds. In numbers 1-5, use the data in the table below on data about Pfizer, Inc. The table describes results from a clinical trial of the drug Viagra. Some subjects were treated with Viagra while others were given a placebo; then headache events were recorded. Headache No Headache Viagra Treatment 117 617 Placebo 29 696 1. Is the study retrospective or prospective? Type R if retrospective or Pif prospective. 2. Solve P(headache | Viagra Treatment). Round off to 3 decimal places. 3. Solve P(headache | placebo). Round off to 3 decimal places. 4. Find the number of Viagra users that would need to stop using Viagra in order to prevent a single headache. Round off to the nearest whole number.
Solve the following problems about Risks and Odds. In numbers 1-5, use the data in the table below on data about Pfizer, Inc. The table describes results from a clinical trial of the drug Viagra. Some subjects were treated with Viagra while others were given a placebo; then headache events were recorded. Headache No Headache Viagra Treatment 117 617 Placebo 29 696 1. Is the study retrospective or prospective? Type R if retrospective or Pif prospective. 2. Solve P(headache | Viagra Treatment). Round off to 3 decimal places. 3. Solve P(headache | placebo). Round off to 3 decimal places. 4. Find the number of Viagra users that would need to stop using Viagra in order to prevent a single headache. Round off to the nearest whole number.

Glencoe Algebra 1, Student Edition, 9780079039897, 0079039898, 2018
18th Edition
ISBN:9780079039897
Author:Carter
Publisher:Carter
Chapter4: Equations Of Linear Functions
Section: Chapter Questions
Problem 8SGR

Related questions

Concept explainers
Contingency Table
A contingency table can be defined as the visual representation of the relationship between two or more categorical variables that can be evaluated and registered. It is a categorical version of the scatterplot, which is used to investigate the linear relationship between two variables. A contingency table is indeed a type of frequency distribution table that displays two variables at the same time.
Binomial Distribution
Binomial is an algebraic expression of the sum or the difference of two terms. Before knowing about binomial distribution, we must know about the binomial theorem.
Topic Video
Question
I only need #4 and #5
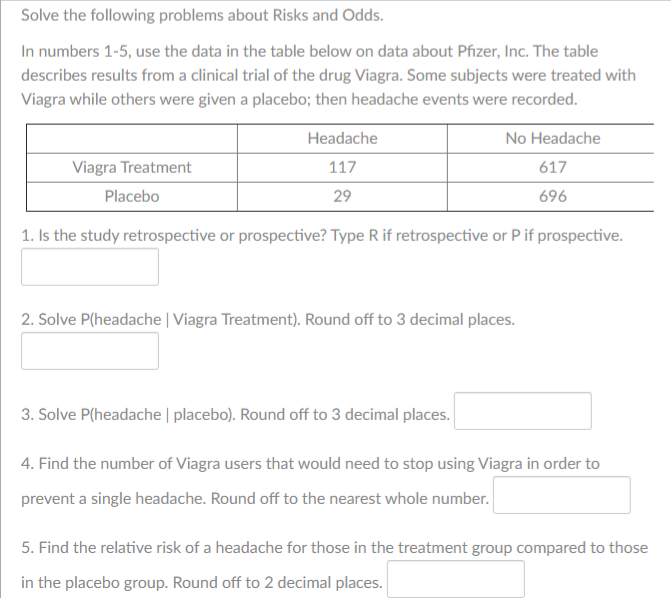
Transcribed Image Text:Solve the following problems about Risks and Odds.
In numbers 1-5, use the data in the table below on data about Pfizer, Inc. The table
describes results from a clinical trial of the drug Viagra. Some subjects were treated with
Viagra while others were given a placebo; then headache events were recorded.
Headache
No Headache
Viagra Treatment
117
617
Placebo
29
696
1. Is the study retrospective or prospective? Type R if retrospective or Pif prospective.
2. Solve P(headache | Viagra Treatment). Round off to 3 decimal places.
3. Solve P(headache | placebo). Round off to 3 decimal places.
4. Find the number of Viagra users that would need to stop using Viagra in order to
prevent a single headache. Round off to the nearest whole number.
5. Find the relative risk of a headache for those in the treatment group compared to those
in the placebo group. Round off to 2 decimal places.
Expert Solution
This question has been solved!
Explore an expertly crafted, step-by-step solution for a thorough understanding of key concepts.

This is a popular solution!

Trending now
This is a popular solution!

Step by step
Solved in 4 steps

Knowledge Booster


Learn more about
Need a deep-dive on the concept behind this application? Look no further. Learn more about this topic, statistics and related others by exploring similar questions and additional content below.Recommended textbooks for you
Glencoe Algebra 1, Student Edition, 9780079039897…
Algebra
ISBN:
9780079039897
Author:
Carter
Publisher:
McGraw Hill

College Algebra (MindTap Course List)
Algebra
ISBN:
9781305652231
Author:
R. David Gustafson, Jeff Hughes
Publisher:
Cengage Learning
Glencoe Algebra 1, Student Edition, 9780079039897…
Algebra
ISBN:
9780079039897
Author:
Carter
Publisher:
McGraw Hill
College Algebra (MindTap Course List)
Algebra
ISBN:
9781305652231
Author:
R. David Gustafson, Jeff Hughes
Publisher:
Cengage Learning