Solve the problem. 16) The graph shows the height h (in meters) of a roller coaster t seconds after the ride starts. Height (ft) 100 80 60 40 20 h 10 a. Over what interval(s) b. Over what interval(s) 1 30 40 Time (sec) does the height increase? does the height decrease? 20 50 60 70
Solve the problem. 16) The graph shows the height h (in meters) of a roller coaster t seconds after the ride starts. Height (ft) 100 80 60 40 20 h 10 a. Over what interval(s) b. Over what interval(s) 1 30 40 Time (sec) does the height increase? does the height decrease? 20 50 60 70

Glencoe Algebra 1, Student Edition, 9780079039897, 0079039898, 2018
18th Edition
ISBN:9780079039897
Author:Carter
Publisher:Carter
Chapter5: Linear Inequalities
Section5.6: Graphing Ineualities In Two Variables
Problem 47PFA

Related questions
Question
Transcribed Image Text:Solve the problem.
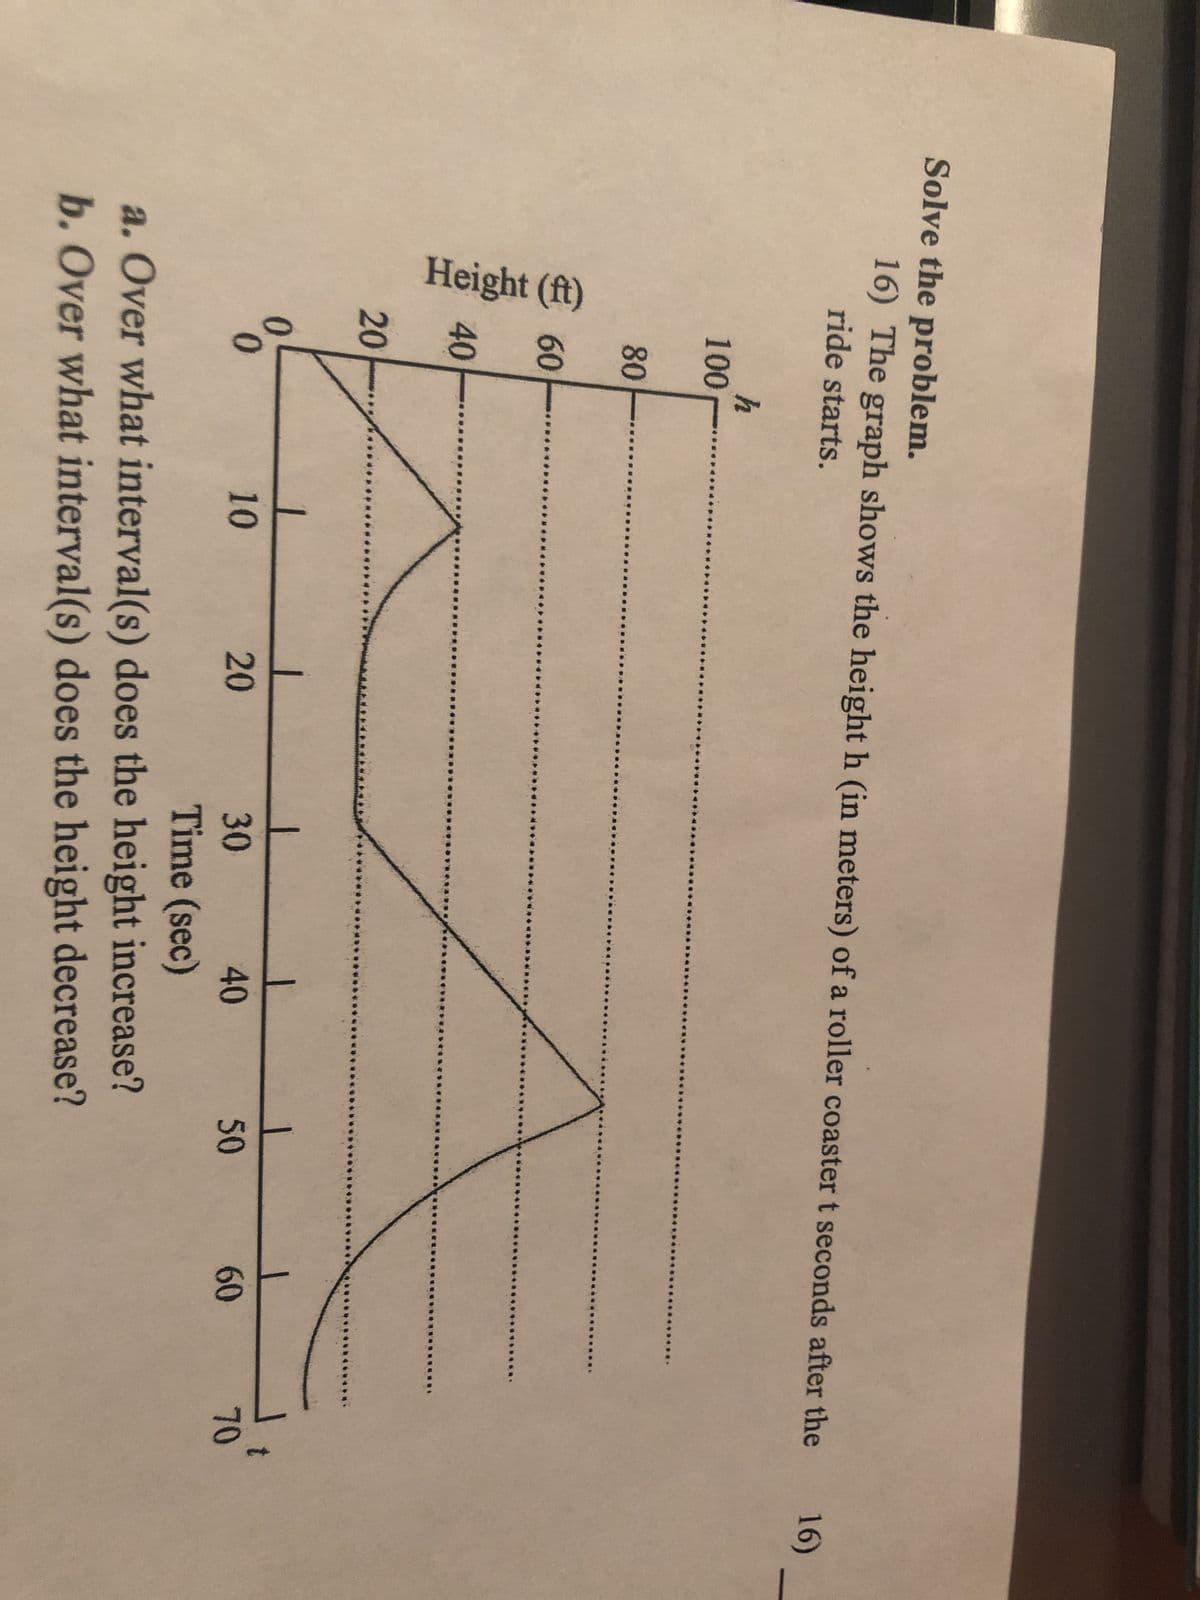
16) The graph shows the height h (in meters) of a roller coaster t seconds after the
ride starts.
Height (ft)
100
80
60
40
20
0
0
h
1
10
20
30
Time (sec)
40
Z
a. Over what interval(s) does the height increase?
b. Over what interval(s) does the height decrease?
50
60
70
16)
Expert Solution
This question has been solved!
Explore an expertly crafted, step-by-step solution for a thorough understanding of key concepts.

Step by step
Solved in 2 steps

Recommended textbooks for you
Glencoe Algebra 1, Student Edition, 9780079039897…
Algebra
ISBN:
9780079039897
Author:
Carter
Publisher:
McGraw Hill

Algebra & Trigonometry with Analytic Geometry
Algebra
ISBN:
9781133382119
Author:
Swokowski
Publisher:
Cengage
Glencoe Algebra 1, Student Edition, 9780079039897…
Algebra
ISBN:
9780079039897
Author:
Carter
Publisher:
McGraw Hill
Algebra & Trigonometry with Analytic Geometry
Algebra
ISBN:
9781133382119
Author:
Swokowski
Publisher:
Cengage