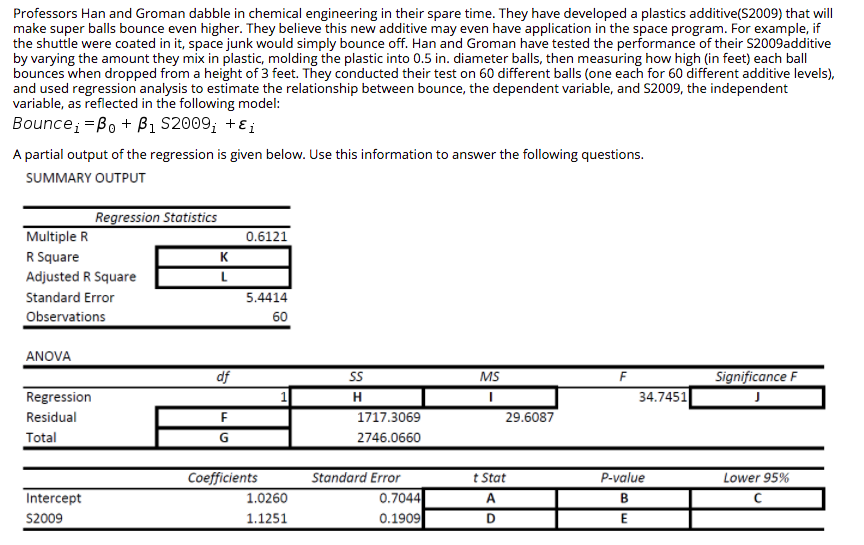
spare plastics S2009) make super balls bounce even higher. They believe this new additive may even have application in the space program. For example, if the shuttle were coated in it, space junk would simply bounce off. Han and Groman have tested the performance of their S2009additive by varying the amount they mix in plastic, molding the plastic into 0.5 in. diameter balls, then measuring how high (in feet) each ball bounces when dropped from a height of 3 feet. They conducted their test on 60 different balls (one each for 60 different additive levels), and used regression analysis to estimate the relationship between bounce, the dependent variable, and S2009, the independent variable, as reflected in the following model: Bounce; =Bo + B1 S2009; +ɛ; A partial output of the regression is given below. Use this information to answer the following questions. SUMMARY OUTPUT Regression Statistics Multiple R 0.6121 K R Square Adjusted R Square Standard Error 5.4414 Observations 60 ANOVA df SS MS F Significance F Regression 34.7451 Residual 1717.3069 29.6087 Total 2746.0660 Standard Error 0.7044 0.1909 t Stat P-value Lower 95% Coefficients 1.0260 Intercept A B S2009 1.1251 D E


Family of Curves
A family of curves is a group of curves that are each described by a parametrization in which one or more variables are parameters. In general, the parameters have more complexity on the assembly of the curve than an ordinary linear transformation. These families appear commonly in the solution of differential equations. When a constant of integration is added, it is normally modified algebraically until it no longer replicates a plain linear transformation. The order of a differential equation depends on how many uncertain variables appear in the corresponding curve. The order of the differential equation acquired is two if two unknown variables exist in an equation belonging to this family.
XZ Plane
In order to understand XZ plane, it's helpful to understand two-dimensional and three-dimensional spaces. To plot a point on a plane, two numbers are needed, and these two numbers in the plane can be represented as an ordered pair (a,b) where a and b are real numbers and a is the horizontal coordinate and b is the vertical coordinate. This type of plane is called two-dimensional and it contains two perpendicular axes, the horizontal axis, and the vertical axis.
Euclidean Geometry
Geometry is the branch of mathematics that deals with flat surfaces like lines, angles, points, two-dimensional figures, etc. In Euclidean geometry, one studies the geometrical shapes that rely on different theorems and axioms. This (pure mathematics) geometry was introduced by the Greek mathematician Euclid, and that is why it is called Euclidean geometry. Euclid explained this in his book named 'elements'. Euclid's method in Euclidean geometry involves handling a small group of innately captivate axioms and incorporating many of these other propositions. The elements written by Euclid are the fundamentals for the study of geometry from a modern mathematical perspective. Elements comprise Euclidean theories, postulates, axioms, construction, and mathematical proofs of propositions.
Lines and Angles
In a two-dimensional plane, a line is simply a figure that joins two points. Usually, lines are used for presenting objects that are straight in shape and have minimal depth or width.
A=
B=
C=


Trending now
This is a popular solution!

Step by step
Solved in 2 steps with 2 images


