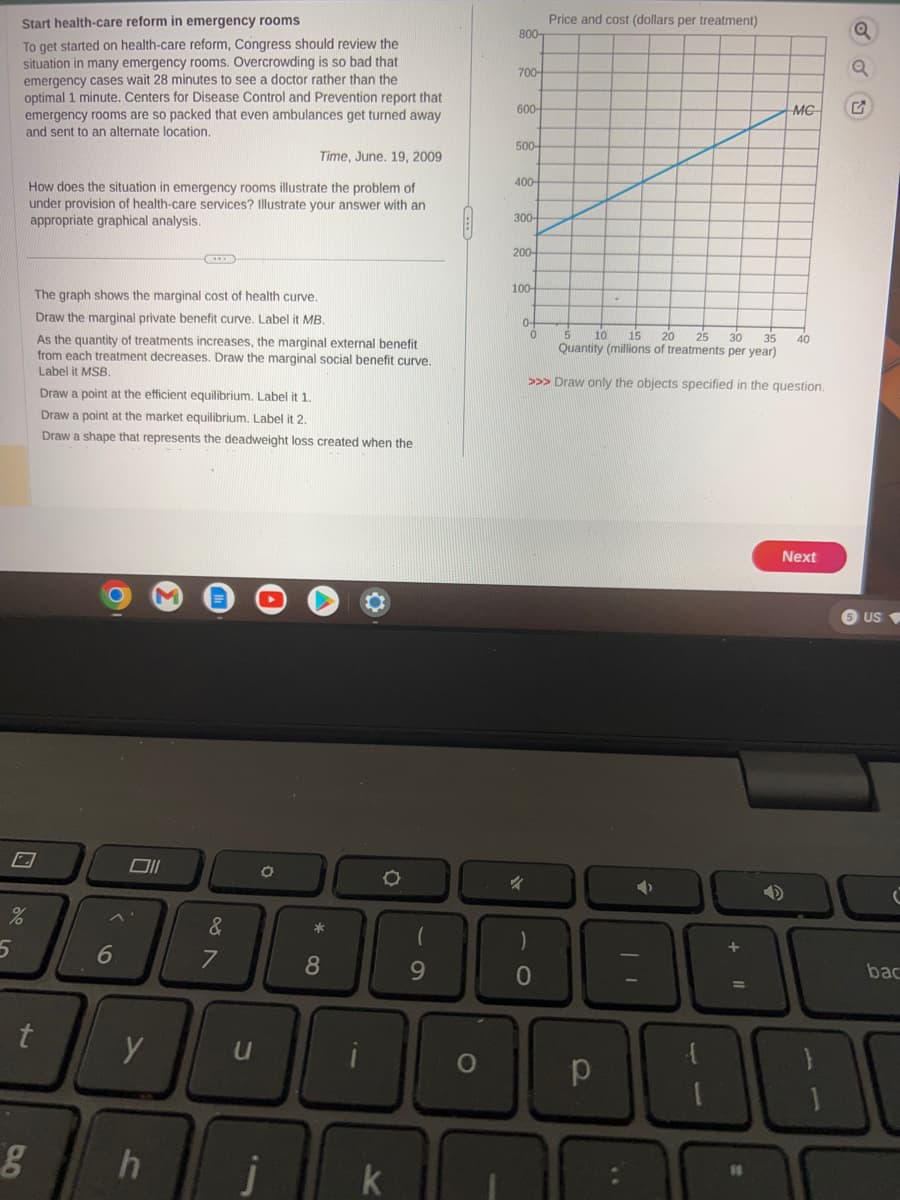
Start health-care reform in emergency rooms To get started on health-care reform, Congress should review the situation in many emergency rooms. Overcrowding is so bad that emergency cases wait 28 minutes to see a doctor rather than the optimal 1 minute. Centers for Disease Control and Prevention report that emergency rooms are so packed that even ambulances get turned away and sent to an alternate location. Time, June. 19, 2009 How does the situation in emergency rooms illustrate the problem of under provision of health-care services? Illustrate your answer with an appropriate graphical analysis. XX The graph shows the marginal cost of health curve. Draw the marginal private benefit curve. Label it MB. As the quantity of treatments increases, the marginal external benefit from each treatment decreases. Draw the marginal social benefit curve. Label it MSB. Draw a point at the efficient equilibrium. Label it 1. Draw a point at the market equilibrium. Label it 2. Draw a shape that represents the deadweight loss created when the 800- 700- 600- 500- 400- 300- 200- 100- 0+ Price and cost (dollars per treatment) MC 5 10 15 20 25 30 35 40 Quantity (millions of treatments per year) >>> Draw only the objects specified in the question. Q Q Q
Start health-care reform in emergency rooms To get started on health-care reform, Congress should review the situation in many emergency rooms. Overcrowding is so bad that emergency cases wait 28 minutes to see a doctor rather than the optimal 1 minute. Centers for Disease Control and Prevention report that emergency rooms are so packed that even ambulances get turned away and sent to an alternate location. Time, June. 19, 2009 How does the situation in emergency rooms illustrate the problem of under provision of health-care services? Illustrate your answer with an appropriate graphical analysis. XX The graph shows the marginal cost of health curve. Draw the marginal private benefit curve. Label it MB. As the quantity of treatments increases, the marginal external benefit from each treatment decreases. Draw the marginal social benefit curve. Label it MSB. Draw a point at the efficient equilibrium. Label it 1. Draw a point at the market equilibrium. Label it 2. Draw a shape that represents the deadweight loss created when the 800- 700- 600- 500- 400- 300- 200- 100- 0+ Price and cost (dollars per treatment) MC 5 10 15 20 25 30 35 40 Quantity (millions of treatments per year) >>> Draw only the objects specified in the question. Q Q Q

Microeconomics: Principles & Policy
14th Edition
ISBN:9781337794992
Author:William J. Baumol, Alan S. Blinder, John L. Solow
Publisher:William J. Baumol, Alan S. Blinder, John L. Solow
Chapter15: The Shortcomings Of Free Markets
Section: Chapter Questions
Problem 1DQ

Related questions

Question
Help plz
Transcribed Image Text:Start health-care reform in emergency rooms.
To get started on health-care reform, Congress should review the
situation in many emergency rooms. Overcrowding is so bad that
emergency cases wait 28 minutes to see a doctor rather than the
optimal 1 minute. Centers for Disease Control and Prevention report that
emergency rooms are so packed that even ambulances get turned away
and sent to an alternate location.
%
5
How does the situation in emergency rooms illustrate the problem of
under provision of health-care services? Illustrate your answer with an
appropriate graphical analysis.
The graph shows the marginal cost of health curve.
Draw the marginal private benefit curve. Label it MB.
As the quantity of treatments increases, the marginal external benefit
from each treatment decreases. Draw the marginal social benefit curve.
Label it MSB.
t
Draw a point at the efficient equilibrium. Label it 1.
Draw a point at the market equilibrium. Label it 2.
Draw a shape that represents the deadweight loss created when the
6
y
g h
&
7
Time, June. 19, 2009
U
1
O
*
8
k
(
9
O
800
700-
600-
500-
400-
300-
200-
100-
0-
Price and cost (dollars per treatment)
0
5
10 15 20 25
Quantity (millions of treatments per year)
>>> Draw only the objects specified in the question.
р
MC
30 35 40
10
+ ||
Next
5 US
bac
900
200
11
Expert Solution
This question has been solved!
Explore an expertly crafted, step-by-step solution for a thorough understanding of key concepts.

Step by step
Solved in 2 steps with 1 images

Knowledge Booster


Learn more about
Need a deep-dive on the concept behind this application? Look no further. Learn more about this topic, economics and related others by exploring similar questions and additional content below.Recommended textbooks for you
Microeconomics: Principles & Policy
Economics
ISBN:
9781337794992
Author:
William J. Baumol, Alan S. Blinder, John L. Solow
Publisher:
Cengage Learning

Principles of Economics 2e
Economics
ISBN:
9781947172364
Author:
Steven A. Greenlaw; David Shapiro
Publisher:
OpenStax
Microeconomics: Principles & Policy
Economics
ISBN:
9781337794992
Author:
William J. Baumol, Alan S. Blinder, John L. Solow
Publisher:
Cengage Learning
Principles of Economics 2e
Economics
ISBN:
9781947172364
Author:
Steven A. Greenlaw; David Shapiro
Publisher:
OpenStax