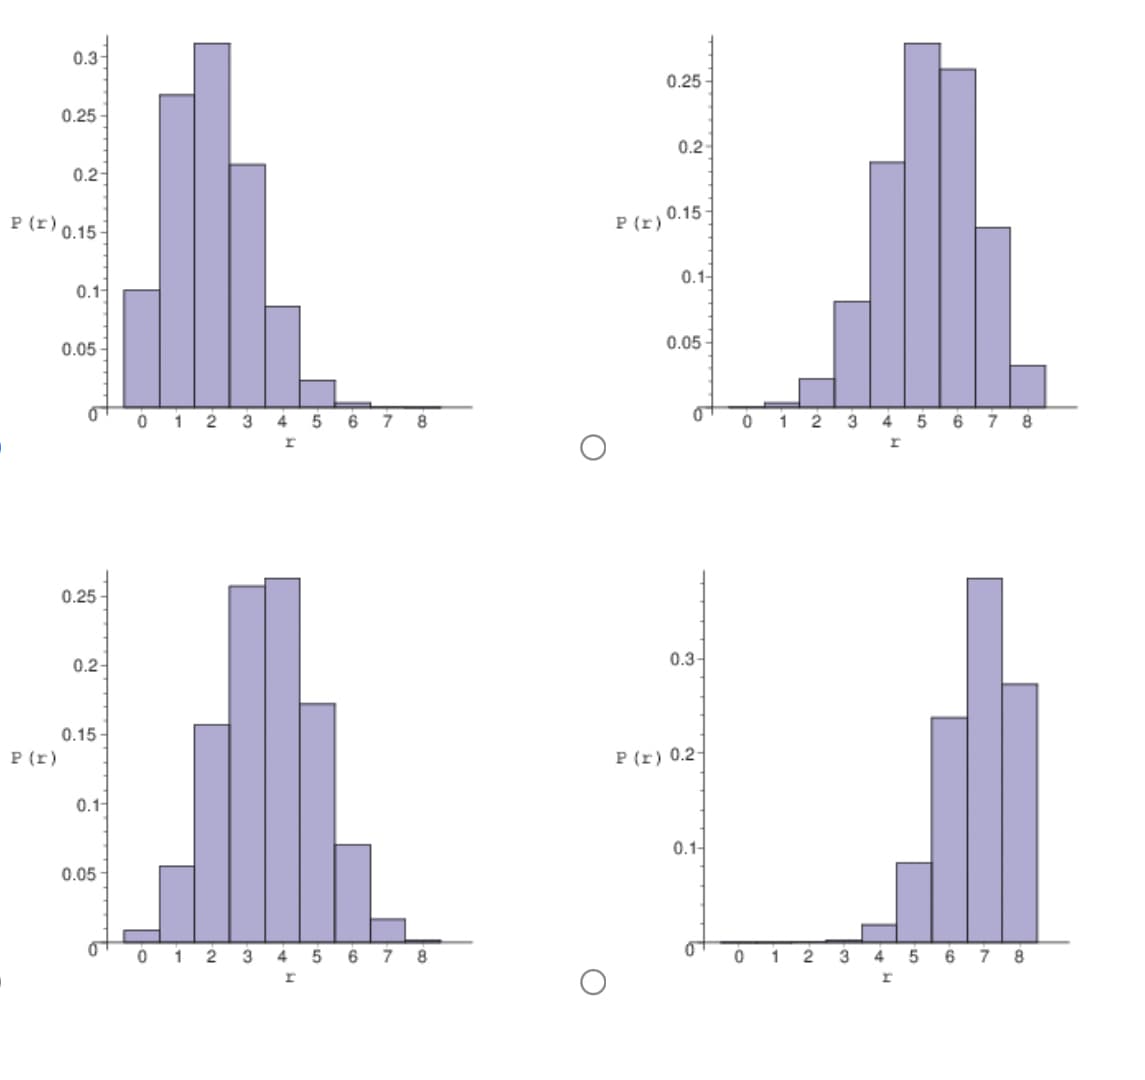
State Farm Insurance studies show that in Colorado, 65% of the auto insurance claims submitted for property damage were submitted by males under 25 years of age. Suppose 8 property damage claims involving automobiles are selected at random. Let r be the number of claims made by males under age 25. Make a histogram for the r-distribution probabilities


Q: A ball is drawn randomly from a jar that contains 8 red balls, 2 white balls, and 7 yellow balls.…
A: Given that Total balls=8+2+7=17 Red balls=8 White balls=2 Yellow balls=7 1 ball are drawn at…
Q: 1. The data given below are the heights (in cm.) of 12 boys who are particip a basketball…
A: "Since you have asked multiple questions, we will solve the first question for you. If you want any…
Q: se the formula in this example to determine the sample size, n. The estimated prevalence is 19%,…
A: Given that,
Q: Tourism is extremely important to the economy of Florida. Hotel occupancy is an often-reported…
A: According our policy we can answer only first three subpart for remaining please repost the…
Q: 2. A radar unit is used to measure speeds of cars on a motorway. The speeds are normally distributed…
A: Given μ=90 km/hrσ=10 km/hr Find The probability that a car picked at random is travelling at more…
Q: Help with this, please! 22.7 E-cigarettes and smoking cessation, continued. Figure 22.3 shows the…
A: Given Information: Minitab output for a chi-square test with a null hypothesis of no association…
Q: Consider two events A and B. Use Venn diagram to show that (AU B) \ A = B\ A
A:
Q: Q/ In the vehicle speed test, the results are given in the table below: Find 1. ArithmeticC mean 2.…
A:
Q: 4. Entry to a certain University is determined by a national test. The scores on this test are…
A: Given: μ = 500 σ = 100
Q: respondents, 12% chose chocolate pie, and the margin of error was given as ±3 percentage…
A: Given: Among the 500 respondents, 12% chose chocolate pie, and the margin of error was given as…
Q: 4. 66% of Americans support death penalty (Gallup, 2004). Seven people are randomly selected. Let…
A: Given that n=7 , p=66%=0.66 X~Binomial(n=7,p=0.66)
Q: The correlation coefficient for number of energy drinks consumed and blood caffeine content is 0.67.…
A: The independent variable is number of energy drinks consumed. The dependent variable is blood…
Q: Are Husbands More Likely to Be Older Than Wives? Exercise 2.213 introduces a dataset giving the ages…
A: Given: x = 75 n = 105 population proportion, p= 0.5 Significance level, α= 0.05
Q: 55% of all statistics classes require a statistical calculator and 25% require the use of a computer…
A: From the provided information, 55% of all statistics classes require a statistical calculator and…
Q: A simple rule of thumb for comparing a project's risk and return by Joe Hardman is : If the expected…
A:
Q: 6.11 Part I of the National Health Plan According to a poll conducted by the Kaiser Family…
A: Given that, According to a poll conducted by the Kaiser Family Foundation in 2019, 79 percent of…
Q: police radar unit measured the speed of 25 cars on Elm Street. The resulting speeds were: 29, 23,…
A: Given that The data are 29, 23, 30, 30, 27, 24, 30, 25, 23, 28, 25, 24, 28, 30, 23, 30, 27, 25, 29,…
Q: What Proportion of College Students Are Satisfied with Their Overall Academic Expereince? Exercise…
A: The random variable who are satisfied with their overall academic experience follows normal…
Q: Sampling 4 pieces of precision-cut wire (to be used in computer assembly) every hour for the past 24…
A: Control limits for x-bar chart: UCL=x¯¯+3R¯LCL=x¯¯-3R¯CL=x¯¯ Consider, Hour x¯ R 1 3.35 0.76…
Q: 2. A radar unit is used to measure speeds of cars on a motorway. The speeds are normally distributed…
A:
Q: A study was done to look at the relationship between number of vacation days employees take each…
A:
Q: The following table displays descriptive statistics on the participants involved in a clinical trial…
A: If the p-value is less than the level of significance of 0.05 then there is a significantly…
Q: From a poll of 900 television viewers, the following data have been accumulated as to their levels…
A: There are two categorical variables which are selection of a TV station and level of education. We…
Q: etime of electronics: In a simple random sample of 100 electronic components produced by a certain…
A: Given: Sample size(n ) = 100 Sample mean x¯=125 Population standard deviation σ =20
Q: 2. An independent research group is interested to show that the percentage of babies deliver through…
A: Question 2: Claim: The percent of births by Cesarian section has decreased. Null Hypothesis: H0:…
Q: A researcher were conducted in the effect of outdoor activity on mood. She hypotthesized that…
A: Given: Mode before Mode after 4 5 3 3 1 4 5 5 1 5 2 4 3 2 4 5 3 4 4 4…
Q: Suppose that people's heights (in centimeters) are normally distributed, with a mean of 170 and a…
A: Given that X~Normal(μ=170,σ=5) Z-score=(X-μ)/σ
Q: c. What is the probability that in a random sample of 2, at least one has been abroad?
A: (C) Let X be the random variable from binomial distribution with probability of people have been…
Q: late the mean cnd the medien frem the folowing froqury table Co-515- 15 lo - 1515-220-25 25 -3 3-55…
A: Class Frequency (f) Mid value (x) f⋅x cf 0-5 5 2.5 12.5 5 5-10 8 7.5 60 13 10-15 10 12.5 125…
Q: Describe how you can make the line of best fit. Write the approximate slope and Y intercept of the…
A: Describe how you can make the line of best fit. Write the approximate slope and Y intercept of the…
Q: le and scatter plot show the number of years of experience, x, and the hourly pay rate, ers in…
A: Given: Equation of best fit is y = 0.8x+8.57
Q: Use the normal distribution and the given sample results to complete the test of the given…
A: We have given that The null hypothesis and alternative hypothesis are H0 : p = 0.25 Ha : p <…
Q: Let X = (X1, X2, ..., Xn) be a sample of n observations each with a uniform in [0,0) density f (x,…
A: Given X=X1, X2, . . ., Xn be a sample of n observations each with a Uniform [0,θ) density as…
Q: Consider the following. Sample A Sample B s2 30 32 n 25 20 We want to test the hypothesis that…
A: According to the given information in this question we need to calculate the test statistic We know…
Q: Suppose we have a 12 sided fair die and we toss it 20 times. What is the expected value of the sum…
A: here die is 12 sided so probability of roll each number = 112 here no of toss = 20
Q: The table summarizes results from pedestrian deaths that were caused by automobile accidents.…
A: Given information: Driver intoxicated?\Pedestrain intoxicated? Yes No Total Yes 48 68 116 No…
Q: Part B: A correlation output between the variables - youthful looking and latest style is as below:…
A: Hello! As you have posted more than 3 sub parts, we are answering the first 3 sub-parts. In case…
Q: If you choose to work with a t-score, how many degrees of freedom would you have? 24 25 26 none of…
A: If we want to perform a t-test then, the degrees of freedom is given by, df = n -1
Q: 2. An achievement test in Statistics was administered to BS Math sophomore in 3 colleges. Determine…
A:
Q: What does a negative correlation coefficient indicate?
A: Pearson correlation measures association in statistics.
Q: In the population of students at Milpitas High School, the proportion who are in the marching band…
A: Given that Population proportion p=0.10 Sample size n =100 Sample proportion p^=0.04
Q: The failure time of a certain component has a Weibull distribution with B = 4, 0 = 2000, and y =…
A:
Q: A survey of 22552255 randomly selected US adults found that 51%51% said they know all or most of…
A:
Q: A random sample of 25 students were asked to self-identify as "statistics-lovers" or…
A: Here degree of freedom df=n1+n2-2 n1=16 n2=9 so Df=16+9-2 =25-2 =23
Q: 12.5 months. The children started wa 15 14
A: sample size (n) = 18 sample mean (x̄) = Σx/n = 249/18 = 13.83 sample standard deviation (s) = √ Σ…
Q: A personality study on university students was conducted to investigate the hypothesis that…
A: Students are grouped into 3 types Introverts Average Extroverts Introverts Average…
Q: fetime of electronics: In a simple random sample of l00 electronic components produced by a certain…
A:
Q: different regions of the Philippines. Region National Capital Region (NCR) Cordillera Administrative…
A: Hi! Thank you for the question, As per the honor code, we are allowed to answer three sub-parts at a…
Q: A charitable organization wishes to estimate, to within one percentage point, the proportion of all…
A: Given e=Margin of error=1%=0.01 Level of significance ɑ=0.02 p^0.=population proportion=25%=0.25…
Q: 4. Entry to a certain University is determined by a national test. The scores on this test are…
A:


Trending now
This is a popular solution!

Step by step
Solved in 2 steps

(a) What is the
(b) What is the expected number of claims made by males under age 25? What is the standard deviation of the r-probability distribution? (Round your standard deviation to two decimal places.)
population mean
population standard deviation
- Suppose that a consumer cannot vary hours of work as he or she chooses. In particular, he or she must choose between working q hours and not working at all, where q > 0. Suppose that dividend income is zero, and that the consumer pays a tax T if he or she works, and receives a benefit b when not working, interpreted as an unemployment insurance payment. a. If the wage rate increases, how does this affect the consumer’s hours of work? What does this have to say about what we would observe about the behavior of actual consumers when wages change? Explained also with the graph b. Suppose that the unemployment insurance benefit increases. How will this affect hours of work? Explain the implications of this for unemployment insurance programs. Explained also with the graphSuppose a company charges a premium of $150 per year for an insurance policy for storm damage to roofs. Actuarial studies show that in case of a storm, the insurance company will pay out an average of $8000 for damage to a composition shingle roof and an average of $12,000 for damage to a shake roof. They also determine that out of every 10,000 policies, there are 7 claims per year made on composition shingle roofs and 11 claims per year made on shake roofs. What is the company’s expected value (i.e., expected profit) per year of a storm insurance policy? What annual profit can the company expect if it issues 1000 such policies? Determine the probability of a composition shingle roof claim out of 10,000 = ______ Determine the probability of a shake roof claim out of 10,000 = ______ How many claims are made out of 10,000? = _______ What is the probability of no claims out of 10,000? = _______ How much does each shingle roof claim cost the company, don’t forget each person pays $150…Price($) W Price ($) A $3.98 $3.99 $2.28 $3.49 $3.08 $5.29 $0.58 $0.60 $2.00 $1.77 $8.98 $10.49 $3.94 $3.99 $3.50 $5.49 $1.50 $0.99 $2.18 $2.29 $3.88 $3.19 $2.78 $2.99 $2.12 $1.00 $0.88 $0.59 $2.64 $2.79 $0.98 $1.99 $0.98 $1.00 $0.75 $1.00 $0.28 $0.29 $2.98 $3.99 $2.82 $2.79 $0.94 $1.19 $1.47 $1.25 $5.48 $4.99 $3.98 $3.99 $3.48 $3.79 $1.08 $1.89 $1.08 $1.00 $1.00 $1.50 $0.58 $0.50 Trying to determine if A is more expenive than W. Test Your Claim for Using a 2 Sample Hypothesis Test with a 5% Level of Significance. 1. Define µ1 and µ2 2. Determine the null and alternate hypothesis and identify the claim. 3. Using technology find the test statistic and interpret it. 4. Make a decision of rejecting or failing to reject the null hypothesis. You can use the Classical Approach (using critical values) or the P-value Approach but you must thoroughly explain which method you used and walk me through your steps. 5. State your…
- x y 1.0 10.0 2.0 9.0 3.0 8.0 4.0 7.0 5.0 6.0 6.0 5.0 7.0 4.0 8.0 3.0 9.0 2.0 10.0 1.0 y 1 2 3 4 5 6 7 8 9 10 11 x 1 2 3 4 5 6 7 8 9 10 11 0 Figure 1 u v 1.0 7.7 2.0 5.4 3.0 10.3 4.0 6.3 5.0 2.2 6.0 4.9 7.0 8.7 8.0 3.5 9.0 9.4 10.0 6.9 v 1 2 3 4 5 6 7 8 9 10 11 u 1 2 3 4 5 6 7 8 9 10 11 0 Figure 2 w t 1.0 3.1 2.0 4.3 3.0 3.6 4.0 5.3 5.0 4.7 6.0 7.0 7.0 6.2 8.0 7.6 9.0 6.9 10.0 8.4 t 1 2 3 4 5 6 7 8 9 10 11 w 1 2 3 4 5 6 7 8 9 10 11 0 Figure 3 m n 1.0 7.2 2.0 9.1 3.0 7.1 4.0 5.4 5.0 7.7 6.0 5.0 7.0 4.3 8.0 6.7 9.0 6.1 10.0 4.4 n 1 2 3 4 5 6 7 8 9 10 11 m 1…A manufacturer of exercise equipment knows that 15% of their products aredefective. They also know that only 35% of their customers will actually use the equipment in the first year after it is purchased. If there is a one-year warranty on the equipment, what proportion of the customers will actually make a valid warranty claim?Number of Girls x P(x) 0 0.003 1 0.021 2 0.118 3 0.208 4 0.300 5 0.208 6 0.118 7 0.021 8 0.003
- Resistors labeled as 100 Ω are purchased from two different vendors. The specification for this type of resistor is that its actual resistance be within 5% of its labeled resistance. In a sample of 180 resistors from vendor A, 149 of them met the specification. In a sample of 270 resistors purchased from vendor B, 233 of them met the specification. Vendor A is the current supplier, but if the data demonstrate convincingly that a greater proportion of the resistors from vendor B meet the specification, a change will be made. P-value?Average Debt of College Graduates Kiplinger’s listed the top 100 public colleges based on many factors. From that list, here is the average debt at graduation for various schools in four selected states. At α=0.05, can it be concluded that the average debt at graduation differs for these four states? New York Virginia California Pennsylvania 18,700 12,859 16,733 26,800 17,375 21,678 14,291 25,179 20,000 17,395 14,323 19,645 52,591 16,000 17,107 20,931 24,415 18,547 15,155 20,148 a.State the null hypotheses H0: u1=u2=u3=u4/ CLAIM OR NOT CLAIM H1: At least one mean is different than the others/ CLAIM OR NOT CLAIM b.Determine the p-valuec. Make the decisionsd. Summarize the resultsDegrees of Freedom 0.995 0.99 0.975 0.95 0.90 0.10 0.05 0.025 0.01 0.005 1 - - 0.001 0.004 0.016 2.706 3.841 5.024 6.635 7.879 2 0.010 0.020 0.051 0.103 0.211 4.605 5.991 7.378 9.210 10.597 3 0.072 0.115 0.216 0.352 0.584 6.251 7.815 9.348 11.345 12.838 4 0.207 0.297 0.484 0.711 1.064 7.779 9.488 11.143 13.277 14.860 5 0.412 0.554 0.831 1.145 1.610 9.236 11.071 12.833 15.086 16.750 6 0.676 0.872 1.237 1.635 2.204 10.645 12.592 14.449 16.812 18.548 7 0.989 1.239 1.690 2.167 2.833 12.017 14.067 16.013 18.475 20.278 8 1.344 1.646 2.180 2.733 3.490 13.362 15.507 17.535 20.090 21.955 9 1.735 2.088 2.700 3.325 4.168 14.684 16.919 19.023 21.666 23.589 10 2.156 2.558 3.247 3.940 4.865 15.987 18.307 20.483 23.209 25.188 Conduct the…
- Resistors labeled as 100 Ω are purchased from two different vendors. The specification for this type of resistor is that its actual resistance be within 5% of its labeled resistance. In a sample of 180 resistors from vendor A, 150 of them met the specification. In a sample of 270 resistors purchased from vendor B, 233 of them met the specification. Vendor A is the current supplier, but if the data demonstrate convincingly that a greater proportion of the resistors from vendor B meet the specification, a change will be made. a) State the appropriate null and alternate hypotheses. b) Find the P-value. c) Should a change be made?Date Ford stock Price y Japanese Yen x1 Deutsche Mark x2 S&P500 x3 1992.1 38.3 133.2 1.64 407.36 1992.2 45.2 125.5 1.53 408.21 1992.3 39.4 119.2 1.41 418.48 1992.4 42.7 124.7 1.61 435.64 1993.1 52.3 121.3 1.61 450.16 1993.2 55.3 110.1 1.69 447.29 1993.3 64.7 105.2 1.62 459.24 1993.4 58.1 111.3 1.73 465.34 1994.1 59.9 103.4 1.76 463.21 1994.2 27.6 99.5 1.6 454.83 1994.3 27.5 98.5 1.55 466.96 1994.4 26.3 99.6 1.38 455.19 1995.1 29.5 89.4 1.39 493.15 1995.2 31.2 84.6 1.42 539.23 1995.3 28.7 98.2 1.43 578.32 1995.4 28.9 102.4 1.48 614.57 1996.1 34.8 106.3 1.52 647.05 1996.2 36.2 109.8 1.58 668.53 1996.3 32.1 110.5 1.61 672.92 1996.4 33.9 112.8 1.69 689.3522 - It is desired to investigate the difference between the satisfaction rates of the customers in different hotels of the same establishment in a region. 1000 out of 1200 randomly selected customers in Hotel A and 1200 of 1500 randomly selected customers in Hotel B stated that they were satisfied with the hotel services. Which of the following is the point estimate of the difference in customer dissatisfaction rates between hotels A and B? a) 0.03 B) 0.08 NS) 0.067 D) -0.067 TO) -0.03
