State if the following is True or false and provide a brief explanation for your answer. Consider Population model Y = Bo + B1X1 + B2X2 + B3X3 + µ. Now consider the following statements a to c. Assumption MLR 1 – 4 is satisfied if and only if: k. One problem with the use of a lagged dependent variable as an explanatory variable is that it always gives rise to autocorrelation. 1. The existence of a exact, linear relationship among some or all explanatory variables of a regression model is called multicollinearity
State if the following is True or false and provide a brief explanation for your answer. Consider Population model Y = Bo + B1X1 + B2X2 + B3X3 + µ. Now consider the following statements a to c. Assumption MLR 1 – 4 is satisfied if and only if: k. One problem with the use of a lagged dependent variable as an explanatory variable is that it always gives rise to autocorrelation. 1. The existence of a exact, linear relationship among some or all explanatory variables of a regression model is called multicollinearity

Linear Algebra: A Modern Introduction
4th Edition
ISBN:9781285463247
Author:David Poole
Publisher:David Poole
Chapter2: Systems Of Linear Equations
Section2.4: Applications
Problem 1EQ: 1. Suppose that, in Example 2.27, 400 units of food A, 600 units of B, and 600 units of C are placed...

Related questions
Question
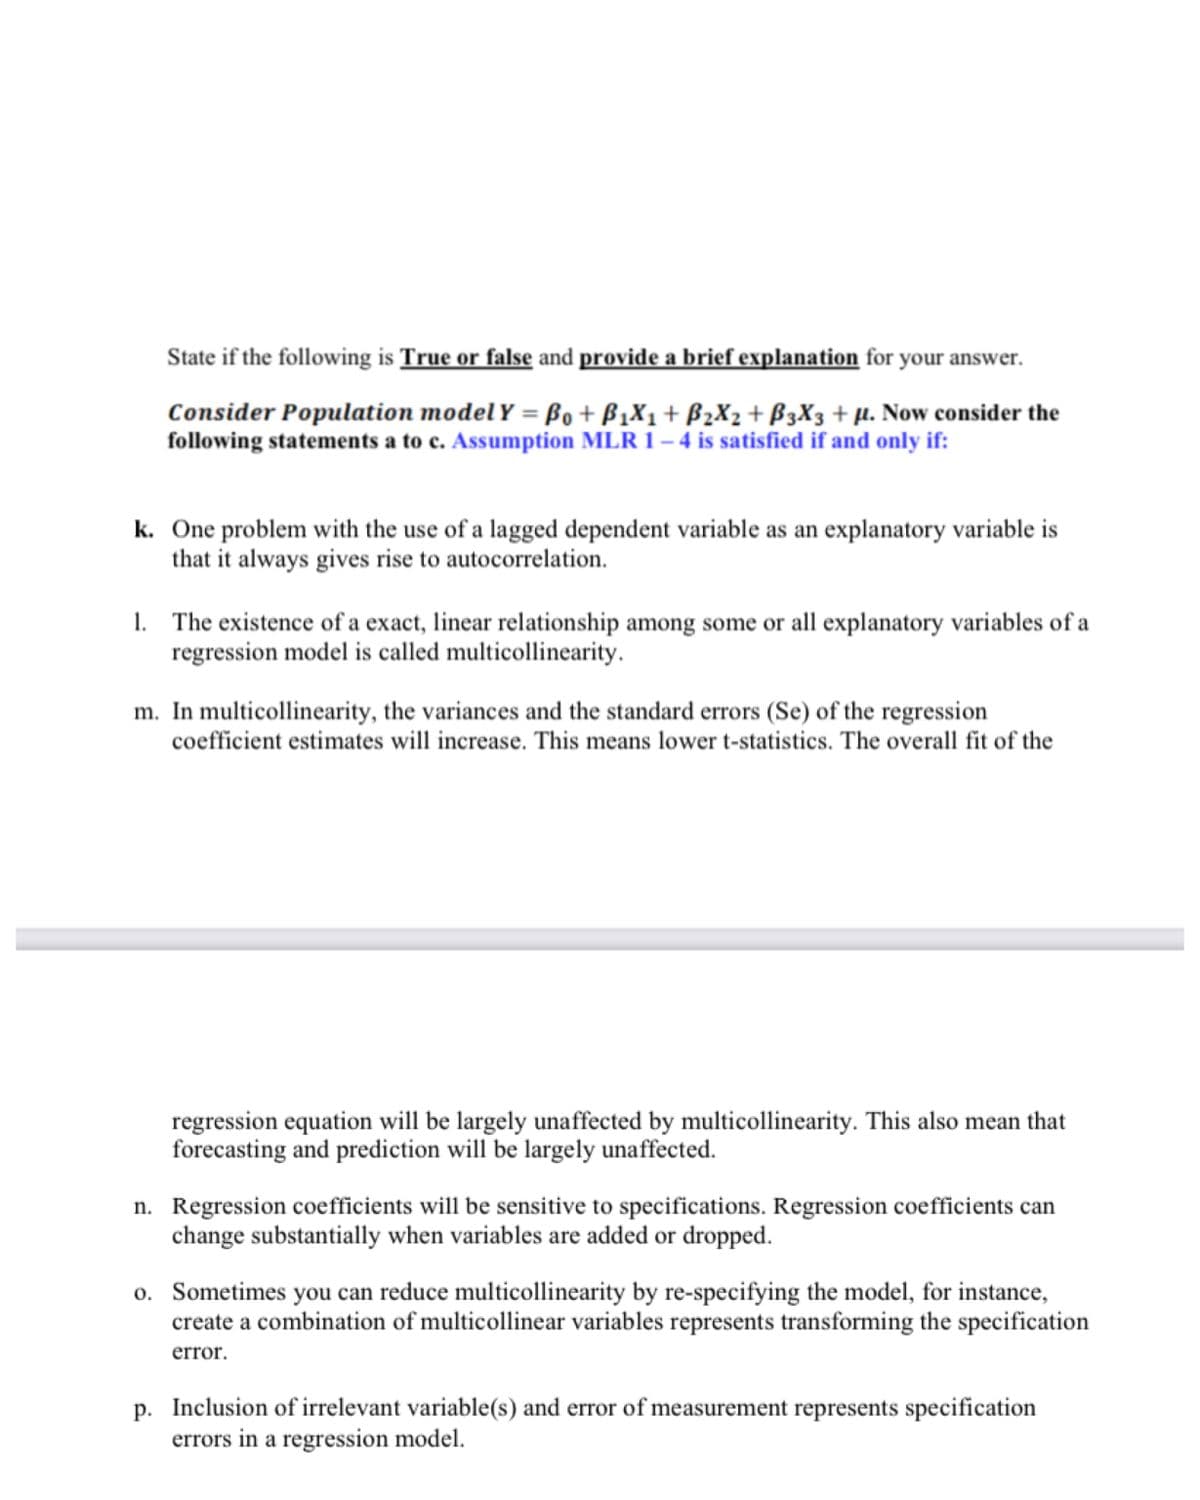
Transcribed Image Text:State if the following is True or false and provide a brief explanation for
your answer.
Consider Population model Y = Bo+ B1X1+ B2X2+ B3X3 + µ. Now consider the
following statements a to c. Assumption MLR 1 – 4 is satisfied if and only if:
k. One problem with the use of a lagged dependent variable as an explanatory variable is
that it always gives rise to autocorrelation.
1. The existence of a exact, linear relationship among some or all explanatory variables of a
regression model is called multicollinearity.
m. In multicollinearity, the variances and the standard errors (Se) of the regression
coefficient estimates will increase. This means lower t-statistics. The overall fit of the
regression equation will be largely unaffected by multicollinearity. This also mean that
forecasting and prediction will be largely unaffected.
n. Regression coefficients will be sensitive to specifications. Regression coefficients can
change substantially when variables are added or dropped.
o. Sometimes you can reduce multicollinearity by re-specifying the model, for instance,
create a combination of multicollinear variables represents transforming the specification
error.
p. Inclusion of irrelevant variable(s) and error of measurement represents specification
errors in a regression model.
Expert Solution
This question has been solved!
Explore an expertly crafted, step-by-step solution for a thorough understanding of key concepts.

Step by step
Solved in 2 steps

Recommended textbooks for you
Linear Algebra: A Modern Introduction
Algebra
ISBN:
9781285463247
Author:
David Poole
Publisher:
Cengage Learning

Algebra & Trigonometry with Analytic Geometry
Algebra
ISBN:
9781133382119
Author:
Swokowski
Publisher:
Cengage
Linear Algebra: A Modern Introduction
Algebra
ISBN:
9781285463247
Author:
David Poole
Publisher:
Cengage Learning
Algebra & Trigonometry with Analytic Geometry
Algebra
ISBN:
9781133382119
Author:
Swokowski
Publisher:
Cengage