(k) Last month, the TSE Index's monthly rate of return was 1.5%. This is, at the end of last month the value of the TSE Index was 1.5% higher than at the beginning of last month. With 95% confidence, find the last month's rate of return on Acme Oil and Gas stock. Lower Bound = 0.109 (use three decimals in your answer) Upper Bound= 1.124 (use three decimals in your answer)

MATLAB: An Introduction with Applications
6th Edition
ISBN:9781119256830
Author:Amos Gilat
Publisher:Amos Gilat
Chapter1: Starting With Matlab
Section: Chapter Questions
Problem 1P
icon
Related questions
Topic Video
Question

Need help with parts d and k. 

Data:


TSERofReturn

AcmeRofReturn

1

0.42478

-0.48194

2

1.61213

-0.73284

3

-0.98754

-2.28445

4

-0.30013

-1.55312

5

1.41215

0.68674

6

0.68725

-1.31132

7

0.03733

-0.83295

8

-1.72494

-1.71975

9

0.33729

1.14443

10

-1.07502

-1.79885

11

0.86222

0.89736

12

1.17468

1.66664

13

-0.38761

-0.02658

14

1.66212

0.9086

15

1.09969

1.99935

16

-0.06266

0.46148

17

-1.96241

-1.41004

18

-1.32499

-0.38086

19

-1.51247

-1.90904

20

0.74974

0.91873

21

-0.38761

-0.49714

22

-0.17514

-1.31385

23

-3.41222

-1.15681

24

-0.01266

2.11718

25

0.16231

1.78766

26

-0.82506

1.30344

27

-0.41261

-0.43377

28

0.2623

-1.70274

29

-1.16251

0.4692

30

-1.05003

0.27671

31

-0.65008

-0.63741

32

0.62475

2.9895

33

-0.68758

1.3613

34

0.62475

0.79354

35

0.09982

0.86949

36

2.14956

-1.1328

37

-0.57509

1.58234

38

0.18731

0.7689

39

0.44978

0.03933

40

1.0247

-1.03319

41

0.08732

-2.28583

42

0.64975

-1.45154

43

2.23705

3.07298

44

-0.25013

-1.03818

45

-0.93754

0.52628

46

-1.17501

0.27986

47

-2.18738

0.25828

48

-1.21251

-1.45743

49

-1.3

-0.87202

50

1.24967

1.12004

51

-2.0249

-0.68836

52

1.8246

1.50198

53

1.36216

0.54255

54

-0.40011

0.05502

55

1.23718

-0.96582

56

1.21218

0.85148

57

1.71211

0.26851

58

-0.15014

1.28931

59

1.53714

-0.42865

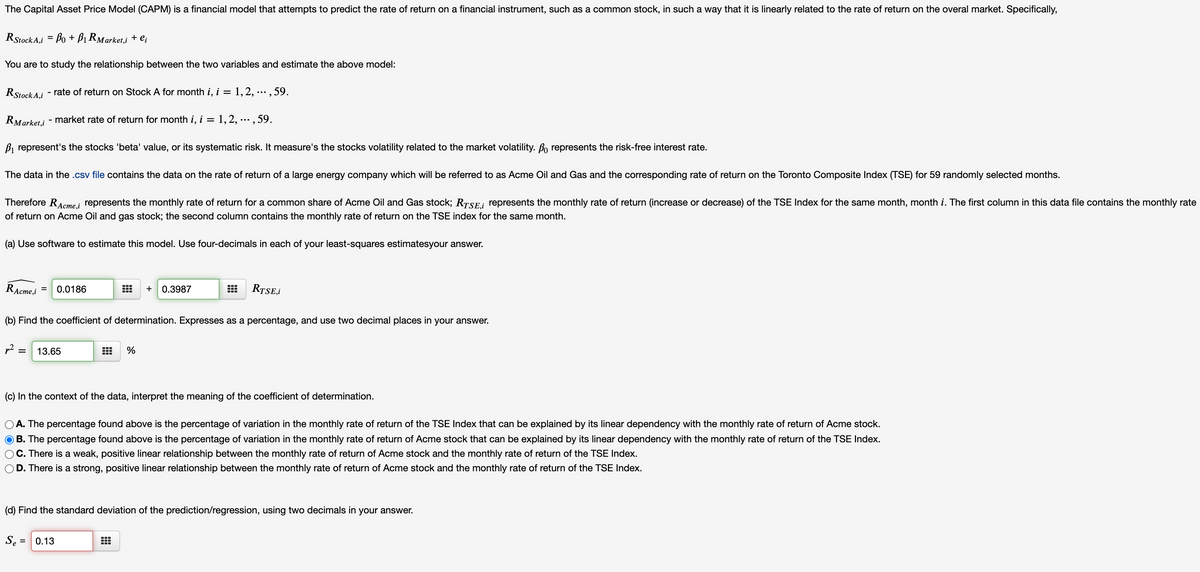
The Capital Asset Price Model (CAPM) is a financial model that attempts to predict the rate of return on a financial instrument, such as a common stock, in such a way that it is linearly related to the rate of return on the overal market. Specifically,
RStock A,i = Bo + Bị RMarket,i + ei
You are to study the relationship between the two variables and estimate the above model:
RStock A.i - rate of return on Stock A for month i, i = 1,2, ... , 59.
%3D
RMarket,i - market rate of return for month i, i = 1,2, ...,59.
%3D
B, represent's the stocks 'beta' value, or its systematic risk. It measure's the stocks volatility related to the market volatility. Bo represents the risk-free interest rate.
The data in the .csv file contains the data on the rate of return of a large energy company which will be referred to as Acme Oil and Gas and the corresponding rate of return on the Toronto Composite Index (TSE) for 59 randomly selected months.
Therefore RAcme,i
represents the monthly rate of return for a common share of Acme Oil and Gas stock; RTSE; represents the monthly rate of return (increase or decrease) of the TSE Index for the same month, month i. The first column in this data file contains the monthly rate
of return on Acme Oil and gas stock; the second column contains the monthly rate of return on the TSE index for the same month.
(a) Use software to estimate this model. Use four-decimals in each of your least-squares estimatesyour answer.
RAcme,i
+ 0.3987
RTSE,i
0.0186
(b) Find the coefficient of determination. Expresses as a percentage, and use two decimal places in your answer.
p2 :
13.65
%
(c) In the context of the data, interpret the meaning of the coefficient of determination.
O A. The percentage found above is the percentage of variation in the monthly rate of return of the TSE Index that can be explained by its linear dependency with the monthly rate of return of Acme stock.
O B. The percentage found above is the percentage of variation in the monthly rate of return of Acme stock that can be explained by its linear dependency with the monthly rate of return of the TSE Index.
C. There is a weak, positive linear relationship between the monthly rate of return of Acme stock and the monthly rate of return of the TSE Index.
D.
There is a strong, positive linear relationship between the monthly rate of return of Acme stock and the monthly rate of return of the TSE Index.
(d) Find the standard deviation of the prediction/regression, using two decimals in your answer.
Se =
0.13
Transcribed Image Text:The Capital Asset Price Model (CAPM) is a financial model that attempts to predict the rate of return on a financial instrument, such as a common stock, in such a way that it is linearly related to the rate of return on the overal market. Specifically, RStock A,i = Bo + Bị RMarket,i + ei You are to study the relationship between the two variables and estimate the above model: RStock A.i - rate of return on Stock A for month i, i = 1,2, ... , 59. %3D RMarket,i - market rate of return for month i, i = 1,2, ...,59. %3D B, represent's the stocks 'beta' value, or its systematic risk. It measure's the stocks volatility related to the market volatility. Bo represents the risk-free interest rate. The data in the .csv file contains the data on the rate of return of a large energy company which will be referred to as Acme Oil and Gas and the corresponding rate of return on the Toronto Composite Index (TSE) for 59 randomly selected months. Therefore RAcme,i represents the monthly rate of return for a common share of Acme Oil and Gas stock; RTSE; represents the monthly rate of return (increase or decrease) of the TSE Index for the same month, month i. The first column in this data file contains the monthly rate of return on Acme Oil and gas stock; the second column contains the monthly rate of return on the TSE index for the same month. (a) Use software to estimate this model. Use four-decimals in each of your least-squares estimatesyour answer. RAcme,i + 0.3987 RTSE,i 0.0186 (b) Find the coefficient of determination. Expresses as a percentage, and use two decimal places in your answer. p2 : 13.65 % (c) In the context of the data, interpret the meaning of the coefficient of determination. O A. The percentage found above is the percentage of variation in the monthly rate of return of the TSE Index that can be explained by its linear dependency with the monthly rate of return of Acme stock. O B. The percentage found above is the percentage of variation in the monthly rate of return of Acme stock that can be explained by its linear dependency with the monthly rate of return of the TSE Index. C. There is a weak, positive linear relationship between the monthly rate of return of Acme stock and the monthly rate of return of the TSE Index. D. There is a strong, positive linear relationship between the monthly rate of return of Acme stock and the monthly rate of return of the TSE Index. (d) Find the standard deviation of the prediction/regression, using two decimals in your answer. Se = 0.13
(k) Last month, the TSE Index's monthly rate of return was 1.5%. This is, at the end of last month the value of the TSE Index was 1.5% higher than at the beginning of last month. With 95% confidence, find the last month's rate of return on Acme Oil and Gas stock.
Lower Bound =
0.109
(use three decimals in your answer)
Upper Bound =
1.124
(use three decimals in your answer)
Transcribed Image Text:(k) Last month, the TSE Index's monthly rate of return was 1.5%. This is, at the end of last month the value of the TSE Index was 1.5% higher than at the beginning of last month. With 95% confidence, find the last month's rate of return on Acme Oil and Gas stock. Lower Bound = 0.109 (use three decimals in your answer) Upper Bound = 1.124 (use three decimals in your answer)
Expert Solution
trending now

Trending now

This is a popular solution!

steps

Step by step

Solved in 2 steps

Blurred answer
Knowledge Booster
Hypothesis Tests and Confidence Intervals for Means
Learn more about
Need a deep-dive on the concept behind this application? Look no further. Learn more about this topic, statistics and related others by exploring similar questions and additional content below.
Similar questions
  • SEE MORE QUESTIONS
Recommended textbooks for you
MATLAB: An Introduction with Applications
Statistics
ISBN:
9781119256830
Author:
Amos Gilat
Publisher:
John Wiley & Sons Inc
Probability and Statistics for Engineering and th…
Statistics
ISBN:
9781305251809
Author:
Jay L. Devore
Publisher:
Cengage Learning
Statistics for The Behavioral Sciences (MindTap C…
Statistics
ISBN:
9781305504912
Author:
Frederick J Gravetter, Larry B. Wallnau
Publisher:
Cengage Learning
Elementary Statistics: Picturing the World (7th E…
Statistics
ISBN:
9780134683416
Author:
Ron Larson, Betsy Farber
Publisher:
PEARSON
The Basic Practice of Statistics
Statistics
ISBN:
9781319042578
Author:
David S. Moore, William I. Notz, Michael A. Fligner
Publisher:
W. H. Freeman
Introduction to the Practice of Statistics
Statistics
ISBN:
9781319013387
Author:
David S. Moore, George P. McCabe, Bruce A. Craig
Publisher:
W. H. Freeman