State % Inc State % Inc Alabama 5.9 Montana 8.1 Alaska 11.4 Nebraska 5.0 Arizona 28.6 Nevada 32.3 Arkansas 8.1 New Hampshire 7.2 California 9.1 New Jersey 3.5 Colorado 16.8 New Mexico 10.5 Connecticut 3.3 New York 3.0 Delaware 13.0 North Carolina 16.6 District of Columbia 4.8 North Dakota 0.7 Florida 16.0 Ohio 1.7 Georgia 20.1 Oklahoma 6.9 Oregon Pennsylvania Hawaii 6.9 11.8 Idaho 19.5 2.6 Illinois 4.0 Rhode Island 0.5 Indiana 5.6 South Carolina 13.7 lowa 2.8 South Dakota 7.6 Kansas 4.8 Tennessee 10.7 Kentucky 6.7 Техas 18.8 Louisiana 0.5 Utah 24.7 Maine 3.4 Vermont 2.1 Maryland 7.6 Virginia 11.4 Washington West Virginia Massachusetts 3.9 13.1 Michigan 0.3 0.6 Minnesota 7.0 Wisconsin 5.4 Mississippi 3.8 Wyoming 10.2 Missouri 7.0 -(Sourww.cis.gov/compendia/statab/rankings.html)
State % Inc State % Inc Alabama 5.9 Montana 8.1 Alaska 11.4 Nebraska 5.0 Arizona 28.6 Nevada 32.3 Arkansas 8.1 New Hampshire 7.2 California 9.1 New Jersey 3.5 Colorado 16.8 New Mexico 10.5 Connecticut 3.3 New York 3.0 Delaware 13.0 North Carolina 16.6 District of Columbia 4.8 North Dakota 0.7 Florida 16.0 Ohio 1.7 Georgia 20.1 Oklahoma 6.9 Oregon Pennsylvania Hawaii 6.9 11.8 Idaho 19.5 2.6 Illinois 4.0 Rhode Island 0.5 Indiana 5.6 South Carolina 13.7 lowa 2.8 South Dakota 7.6 Kansas 4.8 Tennessee 10.7 Kentucky 6.7 Техas 18.8 Louisiana 0.5 Utah 24.7 Maine 3.4 Vermont 2.1 Maryland 7.6 Virginia 11.4 Washington West Virginia Massachusetts 3.9 13.1 Michigan 0.3 0.6 Minnesota 7.0 Wisconsin 5.4 Mississippi 3.8 Wyoming 10.2 Missouri 7.0 -(Sourww.cis.gov/compendia/statab/rankings.html)
Glencoe Algebra 1, Student Edition, 9780079039897, 0079039898, 2018
18th Edition
ISBN:9780079039897
Author:Carter
Publisher:Carter
Chapter10: Statistics
Section: Chapter Questions
Problem 13PT
Related questions
Question
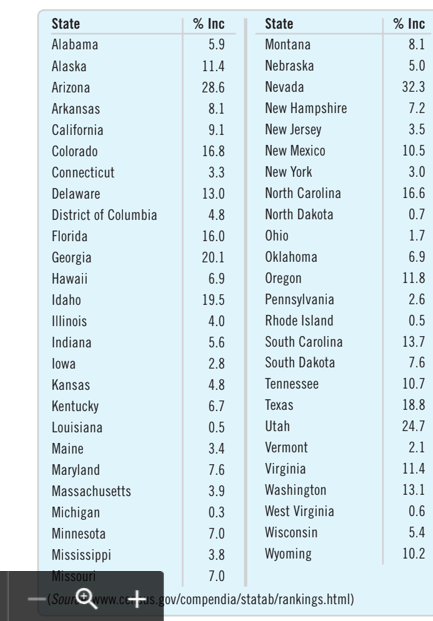
Population growth The following data show the
percentage change in population for the 50 states and
the District of Columbia from 2000 to 2009. Using
appropriate graphical displays and summary statistics,
write a report on the percentage change in population
by state.

Transcribed Image Text:State
% Inc
State
% Inc
Alabama
5.9
Montana
8.1
Alaska
11.4
Nebraska
5.0
Arizona
28.6
Nevada
32.3
Arkansas
8.1
New Hampshire
7.2
California
9.1
New Jersey
3.5
Colorado
16.8
New Mexico
10.5
Connecticut
3.3
New York
3.0
Delaware
13.0
North Carolina
16.6
District of Columbia
4.8
North Dakota
0.7
Florida
16.0
Ohio
1.7
Georgia
20.1
Oklahoma
6.9
Oregon
Pennsylvania
Hawaii
6.9
11.8
Idaho
19.5
2.6
Illinois
4.0
Rhode Island
0.5
Indiana
5.6
South Carolina
13.7
lowa
2.8
South Dakota
7.6
Kansas
4.8
Tennessee
10.7
Kentucky
6.7
Техas
18.8
Louisiana
0.5
Utah
24.7
Maine
3.4
Vermont
2.1
Maryland
7.6
Virginia
11.4
Washington
West Virginia
Massachusetts
3.9
13.1
Michigan
0.3
0.6
Minnesota
7.0
Wisconsin
5.4
Mississippi
3.8
Wyoming
10.2
Missouri
7.0
-(Sourww.cis.gov/compendia/statab/rankings.html)
Expert Solution
This question has been solved!
Explore an expertly crafted, step-by-step solution for a thorough understanding of key concepts.
This is a popular solution!
Trending now
This is a popular solution!
Step by step
Solved in 3 steps with 2 images

Knowledge Booster
Learn more about
Need a deep-dive on the concept behind this application? Look no further. Learn more about this topic, statistics and related others by exploring similar questions and additional content below.Recommended textbooks for you

Glencoe Algebra 1, Student Edition, 9780079039897…
Algebra
ISBN:
9780079039897
Author:
Carter
Publisher:
McGraw Hill

Glencoe Algebra 1, Student Edition, 9780079039897…
Algebra
ISBN:
9780079039897
Author:
Carter
Publisher:
McGraw Hill