State the null and alternative hypotheses. O Hoi Hs0°c = H60°c = H70°C Hgi Hs0oc * H60°C * H70°C O Hoi Hs0°c * Ho0°c * H70°C Hgi Hso°c = H60°c = H70°C Not all the population means are equal. O Hoi Hgi Hs0°c = H60°c = H70°C O Hoi Hsooc = H60°c = H70°c_ H3: Not all the population means are equal. O Ho: At least two of the population means are equal. H3: At least two of the population means are different. Find the value of the test statistic. (Round your answer to two decimal places.) Find the p-value. (Round your answer to four decimal places.) p-value = State your conclusion. Do not reject Ho. There is sufficient evidence to conclude that the mean yields for the three temperatures are not equal. Reject Ho. There is sufficient evidence to conclude that the mean yields for the three temperatures are not equal. Reject Ho. There is not sufficient evidence to conclude that the mean yields for the three temperatures are not equal. Do not reject Ho. There is not sufficient evidence to conclude that the mean vields for the three temperatures are not equal.
State the null and alternative hypotheses. O Hoi Hs0°c = H60°c = H70°C Hgi Hs0oc * H60°C * H70°C O Hoi Hs0°c * Ho0°c * H70°C Hgi Hso°c = H60°c = H70°C Not all the population means are equal. O Hoi Hgi Hs0°c = H60°c = H70°C O Hoi Hsooc = H60°c = H70°c_ H3: Not all the population means are equal. O Ho: At least two of the population means are equal. H3: At least two of the population means are different. Find the value of the test statistic. (Round your answer to two decimal places.) Find the p-value. (Round your answer to four decimal places.) p-value = State your conclusion. Do not reject Ho. There is sufficient evidence to conclude that the mean yields for the three temperatures are not equal. Reject Ho. There is sufficient evidence to conclude that the mean yields for the three temperatures are not equal. Reject Ho. There is not sufficient evidence to conclude that the mean yields for the three temperatures are not equal. Do not reject Ho. There is not sufficient evidence to conclude that the mean vields for the three temperatures are not equal.

MATLAB: An Introduction with Applications
6th Edition
ISBN:9781119256830
Author:Amos Gilat
Publisher:Amos Gilat
Chapter1: Starting With Matlab
Section: Chapter Questions
Problem 1P

Related questions
Topic Video
Question
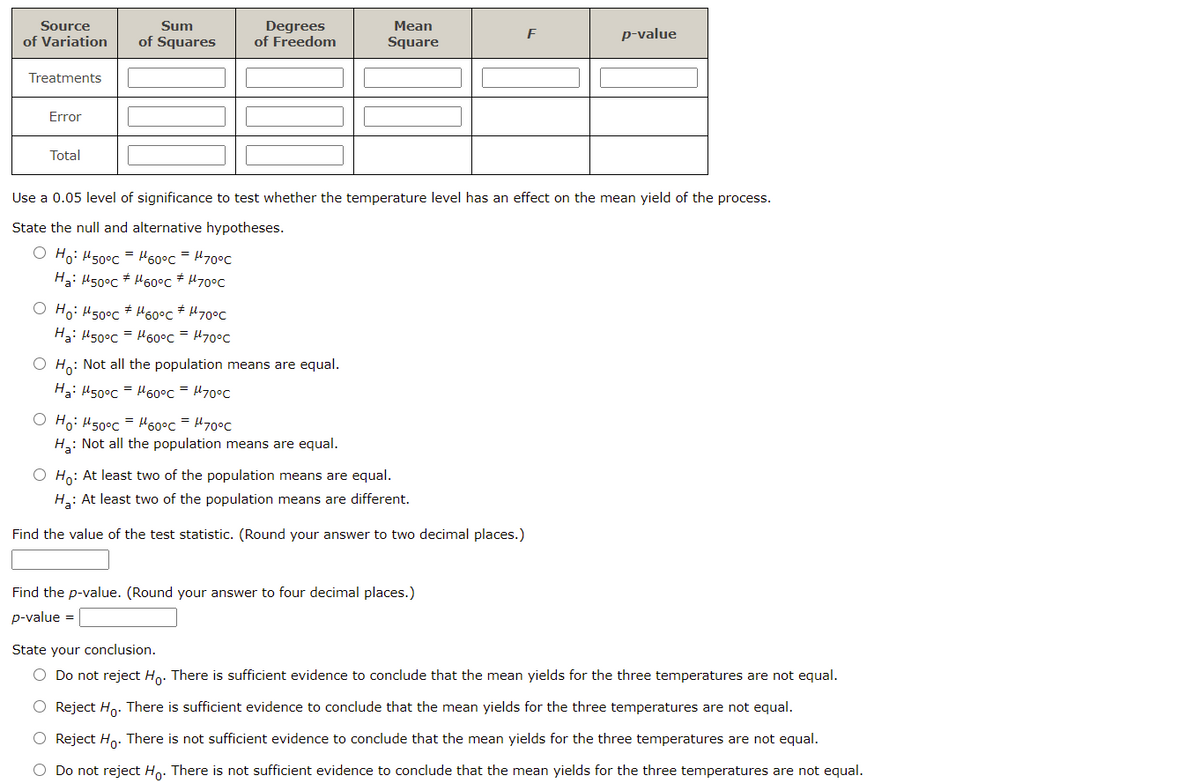
Transcribed Image Text:Source
Sum
Mean
Degrees
of Freedom
F
p-value
of Variation
of Squares
Square
Treatments
Error
Total
Use a 0.05 level of significance to test whether the temperature level has an effect on the mean yield of the process.
State the null and alternative hypotheses.
O Ho: H50°c = Hoo°c = H70°C
H3: H50°c # H60°c * H70°C
O Ho: H50°c # Ho0°c H70°C
H3: H50°c = H60°c = 470°C
O H: Not all the population means are equal.
Ha: H50°c = H60°c = 470°C
O Ho: H50°c = Ho0°c = H70°C
H: Not all the population means are equal.
O Ho: At least two of the population means are equal.
H: At least two of the population means are different.
Find the value of the test statistic. (Round your answer to two decimal places.)
Find the p-value. (Round your answer to four decimal places.)
p-value =
State your conclusion.
O Do not reject Ho. There is sufficient evidence to conclude that the mean yields for the three temperatures are not equal.
O Reject Ho. There is sufficient evidence to conclude that the mean yields for the three temperatures are not equal.
O Reject Ho. There is not sufficient evidence to conclude that the mean yields for the three temperatures are not equal.
O Do not reject Ho. There is not sufficient evidence to conclude that the mean yields for the three temperatures are not equal.
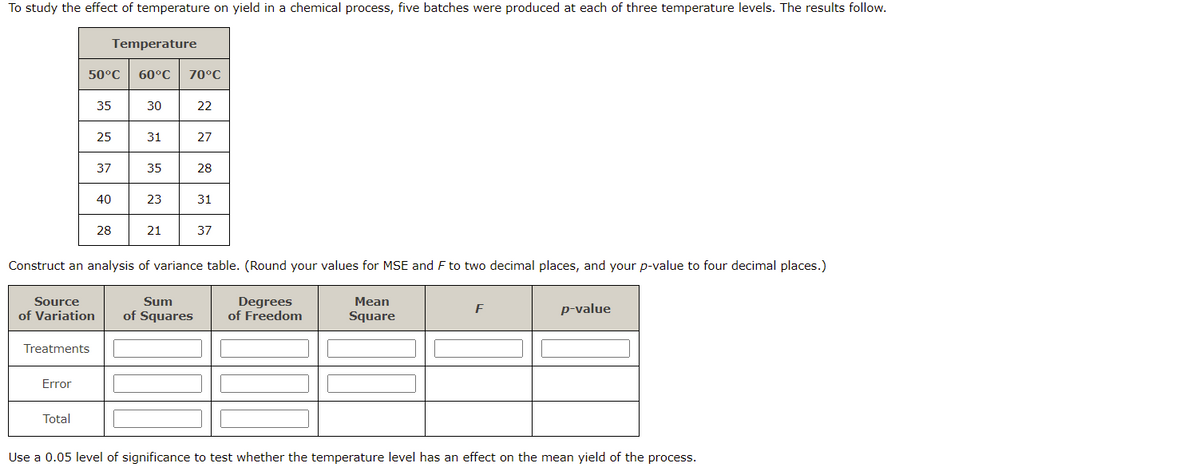
Transcribed Image Text:To study the effect of temperature on yield in a chemical process, five batches were produced at each of three temperature levels. The results follow.
Temperature
50°C
60°C
70°C
35
30
22
25
31
27
37
35
28
40
23
31
28
21
37
Construct an analysis of variance table. (Round your values for MSE and F to two decimal places, and your p-value to four decimal places.)
Source
Sum
Degrees
of Freedom
Mean
F
p-value
of Variation
of Squares
Square
Treatments
Error
Total
Use a 0.05 level of significance to test whether the temperature level has an effect on the mean yield of the process.
Expert Solution
This question has been solved!
Explore an expertly crafted, step-by-step solution for a thorough understanding of key concepts.

Step by step
Solved in 3 steps

Knowledge Booster


Learn more about
Need a deep-dive on the concept behind this application? Look no further. Learn more about this topic, statistics and related others by exploring similar questions and additional content below.Recommended textbooks for you
MATLAB: An Introduction with Applications
Statistics
ISBN:
9781119256830
Author:
Amos Gilat
Publisher:
John Wiley & Sons Inc

Probability and Statistics for Engineering and th…
Statistics
ISBN:
9781305251809
Author:
Jay L. Devore
Publisher:
Cengage Learning

Statistics for The Behavioral Sciences (MindTap C…
Statistics
ISBN:
9781305504912
Author:
Frederick J Gravetter, Larry B. Wallnau
Publisher:
Cengage Learning
MATLAB: An Introduction with Applications
Statistics
ISBN:
9781119256830
Author:
Amos Gilat
Publisher:
John Wiley & Sons Inc
Probability and Statistics for Engineering and th…
Statistics
ISBN:
9781305251809
Author:
Jay L. Devore
Publisher:
Cengage Learning
Statistics for The Behavioral Sciences (MindTap C…
Statistics
ISBN:
9781305504912
Author:
Frederick J Gravetter, Larry B. Wallnau
Publisher:
Cengage Learning

Elementary Statistics: Picturing the World (7th E…
Statistics
ISBN:
9780134683416
Author:
Ron Larson, Betsy Farber
Publisher:
PEARSON

The Basic Practice of Statistics
Statistics
ISBN:
9781319042578
Author:
David S. Moore, William I. Notz, Michael A. Fligner
Publisher:
W. H. Freeman

Introduction to the Practice of Statistics
Statistics
ISBN:
9781319013387
Author:
David S. Moore, George P. McCabe, Bruce A. Craig
Publisher:
W. H. Freeman