Statement I Statement 2 SC Middle manager are the ones responsible for setting operations goals and plans Top level managers are the one who sets up organization's goals and objective To make forecasting effective, you should use complex methods An effective forecasting relies on a single method
Statement I Statement 2 SC Middle manager are the ones responsible for setting operations goals and plans Top level managers are the one who sets up organization's goals and objective To make forecasting effective, you should use complex methods An effective forecasting relies on a single method

Practical Management Science
6th Edition
ISBN:9781337406659
Author:WINSTON, Wayne L.
Publisher:WINSTON, Wayne L.
Chapter13: Regression And Forecasting Models
Section: Chapter Questions
Problem 42P: The file P13_42.xlsx contains monthly data on consumer revolving credit (in millions of dollars)...

Related questions
Question
Identify both statement, which is statement 1 and statement 2 whether it is true or false and provide references
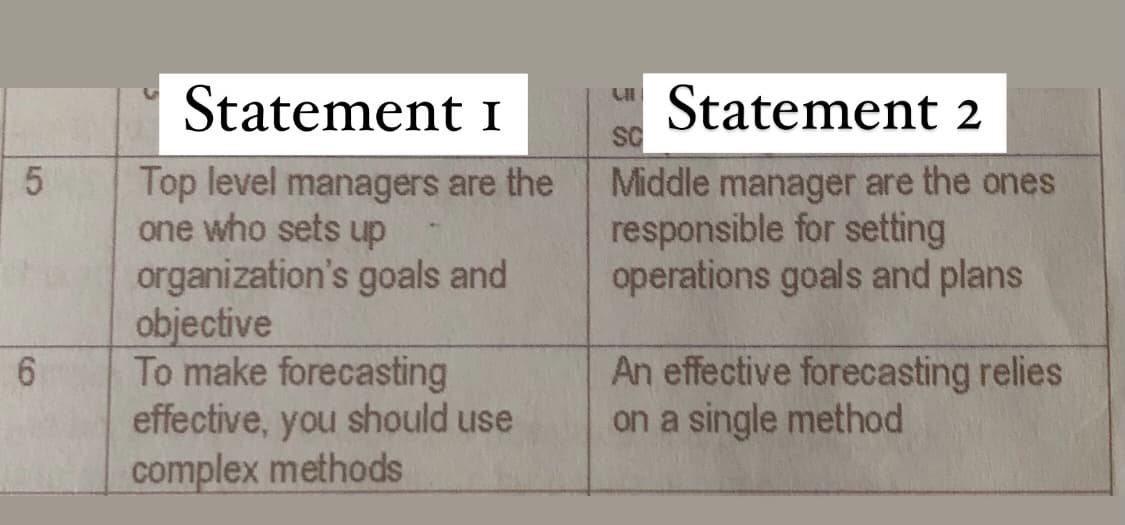
Transcribed Image Text:Statement I
Statement 2
SC
Middle manager are the ones
responsible for setting
operations goals and plans
Top level managers are the
one who sets up
organization's goals and
objective
To make forecasting
effective, you should use
complex methods
An effective forecasting relies
on a single method
Expert Solution
This question has been solved!
Explore an expertly crafted, step-by-step solution for a thorough understanding of key concepts.

This is a popular solution!

Trending now
This is a popular solution!

Step by step
Solved in 2 steps

Recommended textbooks for you
Practical Management Science
Operations Management
ISBN:
9781337406659
Author:
WINSTON, Wayne L.
Publisher:
Cengage,

Contemporary Marketing
Marketing
ISBN:
9780357033777
Author:
Louis E. Boone, David L. Kurtz
Publisher:
Cengage Learning

Marketing
Marketing
ISBN:
9780357033791
Author:
Pride, William M
Publisher:
South Western Educational Publishing
Practical Management Science
Operations Management
ISBN:
9781337406659
Author:
WINSTON, Wayne L.
Publisher:
Cengage,
Contemporary Marketing
Marketing
ISBN:
9780357033777
Author:
Louis E. Boone, David L. Kurtz
Publisher:
Cengage Learning
Marketing
Marketing
ISBN:
9780357033791
Author:
Pride, William M
Publisher:
South Western Educational Publishing