Statement of the Problem: Is there a significant difference on Productline – X11 when grouped according to Industry Type – X2? Null Hypothesis: There is no significant difference on Productline – X11 when grouped according to Industry Type – X2. Note: The coding for Industry Type is 0 for Magazine Industry and 1 for Newsprint Industry. interpret the T-Test results
Statement of the Problem: Is there a significant difference on Productline – X11 when grouped according to Industry Type – X2? Null Hypothesis: There is no significant difference on Productline – X11 when grouped according to Industry Type – X2. Note: The coding for Industry Type is 0 for Magazine Industry and 1 for Newsprint Industry. interpret the T-Test results

MATLAB: An Introduction with Applications
6th Edition
ISBN:9781119256830
Author:Amos Gilat
Publisher:Amos Gilat
Chapter1: Starting With Matlab
Section: Chapter Questions
Problem 1P

Related questions
Question
Is there a significant difference on the ratings of the respondents on X11 when grouped according to X2?
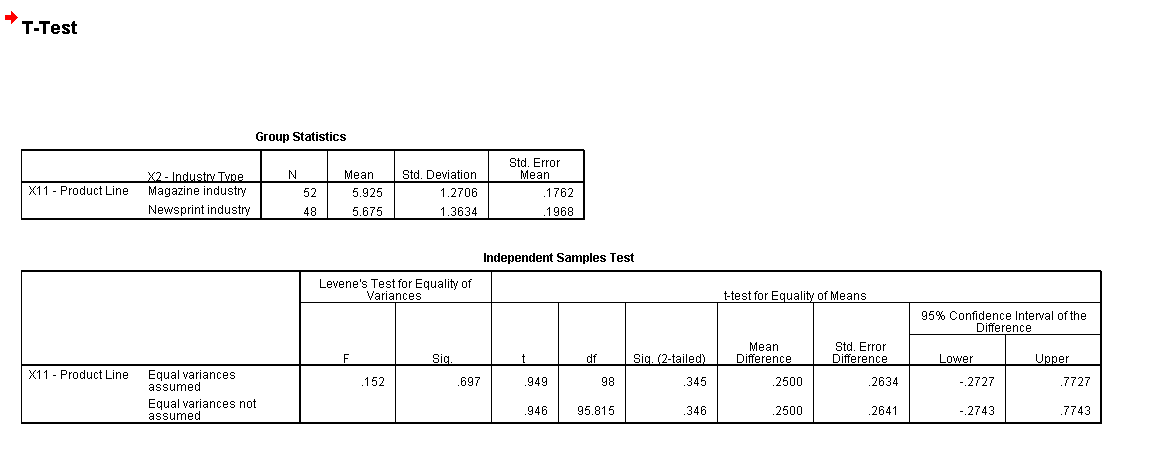
Statement of the Problem: Is there a significant difference on Productline – X11 when grouped according to Industry Type – X2?
Null Hypothesis: There is no significant difference on Productline – X11 when grouped according to Industry Type – X2.
Note: The coding for Industry Type is 0 for Magazine Industry and 1 for Newsprint Industry.
interpret the T-Test results
Transcribed Image Text:T-Test
X11 Product Line
X11 Product Line
X2 - Industry Type
Magazine industry
Newsprint industry
Equal variances
assumed
Group Statistics
Equal variances not
assumed
N
52
48
Mean
5.925
5.675
Levene's Test for Equality of
Variances
F
Std. Deviation
1.2706
1.3634
152
Siq.
.697
Std. Error
Mean
.1762
.1968
Independent Samples Test
t
.949
.946
df
98
95.815
Sig. (2-tailed)
.345
.346
t-test for Equality of Means
Mean
Difference
2500
.2500
Std. Error
Difference
.2634
.2641
95% Confidence Interval of the
Difference
Lower
-.2727
-.2743
Upper
.7727
.7743
Expert Solution
This question has been solved!
Explore an expertly crafted, step-by-step solution for a thorough understanding of key concepts.

Step by step
Solved in 2 steps

Recommended textbooks for you
MATLAB: An Introduction with Applications
Statistics
ISBN:
9781119256830
Author:
Amos Gilat
Publisher:
John Wiley & Sons Inc

Probability and Statistics for Engineering and th…
Statistics
ISBN:
9781305251809
Author:
Jay L. Devore
Publisher:
Cengage Learning

Statistics for The Behavioral Sciences (MindTap C…
Statistics
ISBN:
9781305504912
Author:
Frederick J Gravetter, Larry B. Wallnau
Publisher:
Cengage Learning
MATLAB: An Introduction with Applications
Statistics
ISBN:
9781119256830
Author:
Amos Gilat
Publisher:
John Wiley & Sons Inc
Probability and Statistics for Engineering and th…
Statistics
ISBN:
9781305251809
Author:
Jay L. Devore
Publisher:
Cengage Learning
Statistics for The Behavioral Sciences (MindTap C…
Statistics
ISBN:
9781305504912
Author:
Frederick J Gravetter, Larry B. Wallnau
Publisher:
Cengage Learning

Elementary Statistics: Picturing the World (7th E…
Statistics
ISBN:
9780134683416
Author:
Ron Larson, Betsy Farber
Publisher:
PEARSON

The Basic Practice of Statistics
Statistics
ISBN:
9781319042578
Author:
David S. Moore, William I. Notz, Michael A. Fligner
Publisher:
W. H. Freeman

Introduction to the Practice of Statistics
Statistics
ISBN:
9781319013387
Author:
David S. Moore, George P. McCabe, Bruce A. Craig
Publisher:
W. H. Freeman