Statistic use A. Z com = -1 Z tab=2.575 Z tab=-2.575 39. What will be the decision? A. Reject Ho B. Fail to Reject Ho C. 40. Which of the following set of values DO NOT satisfy the assum A. n=100 and p=20% B. n=60 and q = 10% C. For item nos. 41-42. A sample of 100 students were selected at r Test the hypothesis that less than 20% of the population are w 36. What is B. Z. com = 1
Statistic use A. Z com = -1 Z tab=2.575 Z tab=-2.575 39. What will be the decision? A. Reject Ho B. Fail to Reject Ho C. 40. Which of the following set of values DO NOT satisfy the assum A. n=100 and p=20% B. n=60 and q = 10% C. For item nos. 41-42. A sample of 100 students were selected at r Test the hypothesis that less than 20% of the population are w 36. What is B. Z. com = 1

College Algebra (MindTap Course List)
12th Edition
ISBN:9781305652231
Author:R. David Gustafson, Jeff Hughes
Publisher:R. David Gustafson, Jeff Hughes
Chapter8: Sequences, Series, And Probability
Section8.7: Probability
Problem 58E: What is meant by the sample space of an experiment?

Related questions
Question
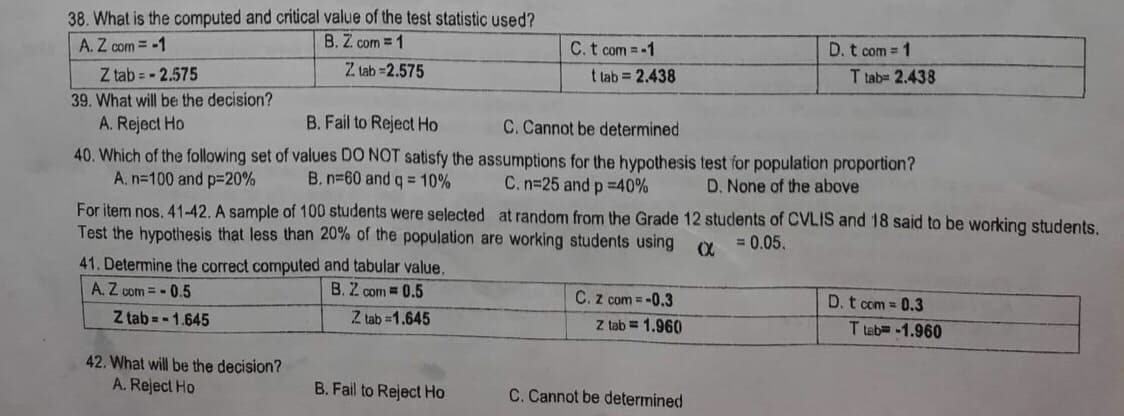
Transcribed Image Text:38. What is the computed and critical value of the test statistic used?
B. Z.com = 1
A. Z com = -1
Z tab=2.575
t tab = 2.438
T tab= 2.438
Z tab= 2.575
39. What will be the decision?
A. Reject Ho
B. Fail to Reject Ho
C. Cannot be determined
40. Which of the following set of values DO NOT satisfy the assumptions for the hypothesis test for population proportion?
A. n=100 and p=20%
B. n-60 and q = 10%
D. None of the above
C. n=25 and p =40%
For item nos, 41-42. A sample of 100 students were selected at random from the Grade 12 students of CVLIS and 18 said to be working students.
Test the hypothesis that less than 20% of the population are working students using
XX = 0.05.
41. Determine the correct computed and tabular value.
A. Z com = -0.5
B. Z com = 0.5
C. Z com = -0.3
D. t com = 0.3
Z tab=-1.645
Z tab=1.645
Z tab= 1.960
42. What will be the decision?
A. Reject Ho
B. Fail to Reject Ho
C. Cannot be determined
C. t com = -1
D. t com = 1
T tab= -1.960
Expert Solution
This question has been solved!
Explore an expertly crafted, step-by-step solution for a thorough understanding of key concepts.

Step by step
Solved in 2 steps

Recommended textbooks for you
College Algebra (MindTap Course List)
Algebra
ISBN:
9781305652231
Author:
R. David Gustafson, Jeff Hughes
Publisher:
Cengage Learning
College Algebra (MindTap Course List)
Algebra
ISBN:
9781305652231
Author:
R. David Gustafson, Jeff Hughes
Publisher:
Cengage Learning