... 95% for u: or (100.56, 111.12) CONFIDENCE INTERVALS FOR THE MEAN u 08 06 OL IQ scores OL 120 130 CURE 14.4 Dotplot of thne la scores of 31 seventh-grade girls. . Check the conditions for inference. Here are the “simple conditions": PS: The girls are an SRS from the population of all seventh-grade girls in the school district. lues that are typically rounded to the nearest integer when provided. We eYpect from experience that IQ scores in a homogeneous population with similar developmental age will follow approximately a Normal distribution. We can't look at the population, but we can examine the sample. Figure 14.4 shows a dotplot of the data. Its shape is slightly left-skewed, but there are no extreme outliers. Thus, we have no reason to doubt that the population dis- Tribution is close to Normal. Additionally, the central limit theorem tells us that a sample size of 31 is large enough to overcome moderate departures from Normality for performing inference. STE A EXVN 3. Known o: Most IQ tests are designed so that o = 15, so it is not unrealistic to assume that we know that o = 15 for our calculations. SOLVE: Obtain the confidence interval. Using statistical software and inputting the raw data, we obtain a 95% confidence interval of (100.56, 111.12) for the mean IQ score u in this population. CONCLUDE: We are 95% confident that the mean IQ score for all seventh-grade girls in this Midwest school district is between 100.6 and 111.1. The computations performed by any statistical software in this example involve the following steps: Sample mean: I = 105.84 Critical value for a 95% confidence level: 2* =1.960 %3D Margin of error: m = 2* o//n= (1.96)(15)//31 =5.28 %3D * 5% confidence interval for u:±m=105.84 ±5.28, or (100.56, 111.12) n thir introductory chapter, we work with examples for which the "simple dlu inference methods are often APPLY YOUR KNOWLEDGE 14.4 Critical value and confidence level. This section provided the Normal crie ical values z* for three commonly used confidence levels (90%, 95%, and 99%) Explain briefly why the critical value must be larger for a larger confidence level 14.5 Pharmaceutical production. A manufacturer of pharmaceutical products ana- lyzes each batch of a product to verify the concentration of the active ingredient. The chemical analysis is not perfectly precise. In fact, repeated measurements follow a Normal distribution with mean u equal to the true concentration and with standard deviation o = 0.0068 grams per liter (g/l). Three analyses of one batch give concentrations of 0.8403, 0.8363, and 0.8447 g/l. To estimate the true concentration, give a 95% confidence interval for u. Follow the four-step process as illustrated in Example 14.3. loordba bsh HYPOTHESIS TESTING Confidence intervals are one of the two most common types of statistical infe ence. Use a confidence interval when your goal is to estimate a population parar eter. Another common type of inference, called hypothesis tests (or sometim
... 95% for u: or (100.56, 111.12) CONFIDENCE INTERVALS FOR THE MEAN u 08 06 OL IQ scores OL 120 130 CURE 14.4 Dotplot of thne la scores of 31 seventh-grade girls. . Check the conditions for inference. Here are the “simple conditions": PS: The girls are an SRS from the population of all seventh-grade girls in the school district. lues that are typically rounded to the nearest integer when provided. We eYpect from experience that IQ scores in a homogeneous population with similar developmental age will follow approximately a Normal distribution. We can't look at the population, but we can examine the sample. Figure 14.4 shows a dotplot of the data. Its shape is slightly left-skewed, but there are no extreme outliers. Thus, we have no reason to doubt that the population dis- Tribution is close to Normal. Additionally, the central limit theorem tells us that a sample size of 31 is large enough to overcome moderate departures from Normality for performing inference. STE A EXVN 3. Known o: Most IQ tests are designed so that o = 15, so it is not unrealistic to assume that we know that o = 15 for our calculations. SOLVE: Obtain the confidence interval. Using statistical software and inputting the raw data, we obtain a 95% confidence interval of (100.56, 111.12) for the mean IQ score u in this population. CONCLUDE: We are 95% confident that the mean IQ score for all seventh-grade girls in this Midwest school district is between 100.6 and 111.1. The computations performed by any statistical software in this example involve the following steps: Sample mean: I = 105.84 Critical value for a 95% confidence level: 2* =1.960 %3D Margin of error: m = 2* o//n= (1.96)(15)//31 =5.28 %3D * 5% confidence interval for u:±m=105.84 ±5.28, or (100.56, 111.12) n thir introductory chapter, we work with examples for which the "simple dlu inference methods are often APPLY YOUR KNOWLEDGE 14.4 Critical value and confidence level. This section provided the Normal crie ical values z* for three commonly used confidence levels (90%, 95%, and 99%) Explain briefly why the critical value must be larger for a larger confidence level 14.5 Pharmaceutical production. A manufacturer of pharmaceutical products ana- lyzes each batch of a product to verify the concentration of the active ingredient. The chemical analysis is not perfectly precise. In fact, repeated measurements follow a Normal distribution with mean u equal to the true concentration and with standard deviation o = 0.0068 grams per liter (g/l). Three analyses of one batch give concentrations of 0.8403, 0.8363, and 0.8447 g/l. To estimate the true concentration, give a 95% confidence interval for u. Follow the four-step process as illustrated in Example 14.3. loordba bsh HYPOTHESIS TESTING Confidence intervals are one of the two most common types of statistical infe ence. Use a confidence interval when your goal is to estimate a population parar eter. Another common type of inference, called hypothesis tests (or sometim

Glencoe Algebra 1, Student Edition, 9780079039897, 0079039898, 2018
18th Edition
ISBN:9780079039897
Author:Carter
Publisher:Carter
Chapter10: Statistics
Section10.3: Measures Of Spread
Problem 1GP

Related questions
Question
14.5 please!
Transcribed Image Text:...
95% for u: or (100.56, 111.12)
CONFIDENCE INTERVALS FOR THE MEAN u
08
06
OL
IQ scores
OL
120
130
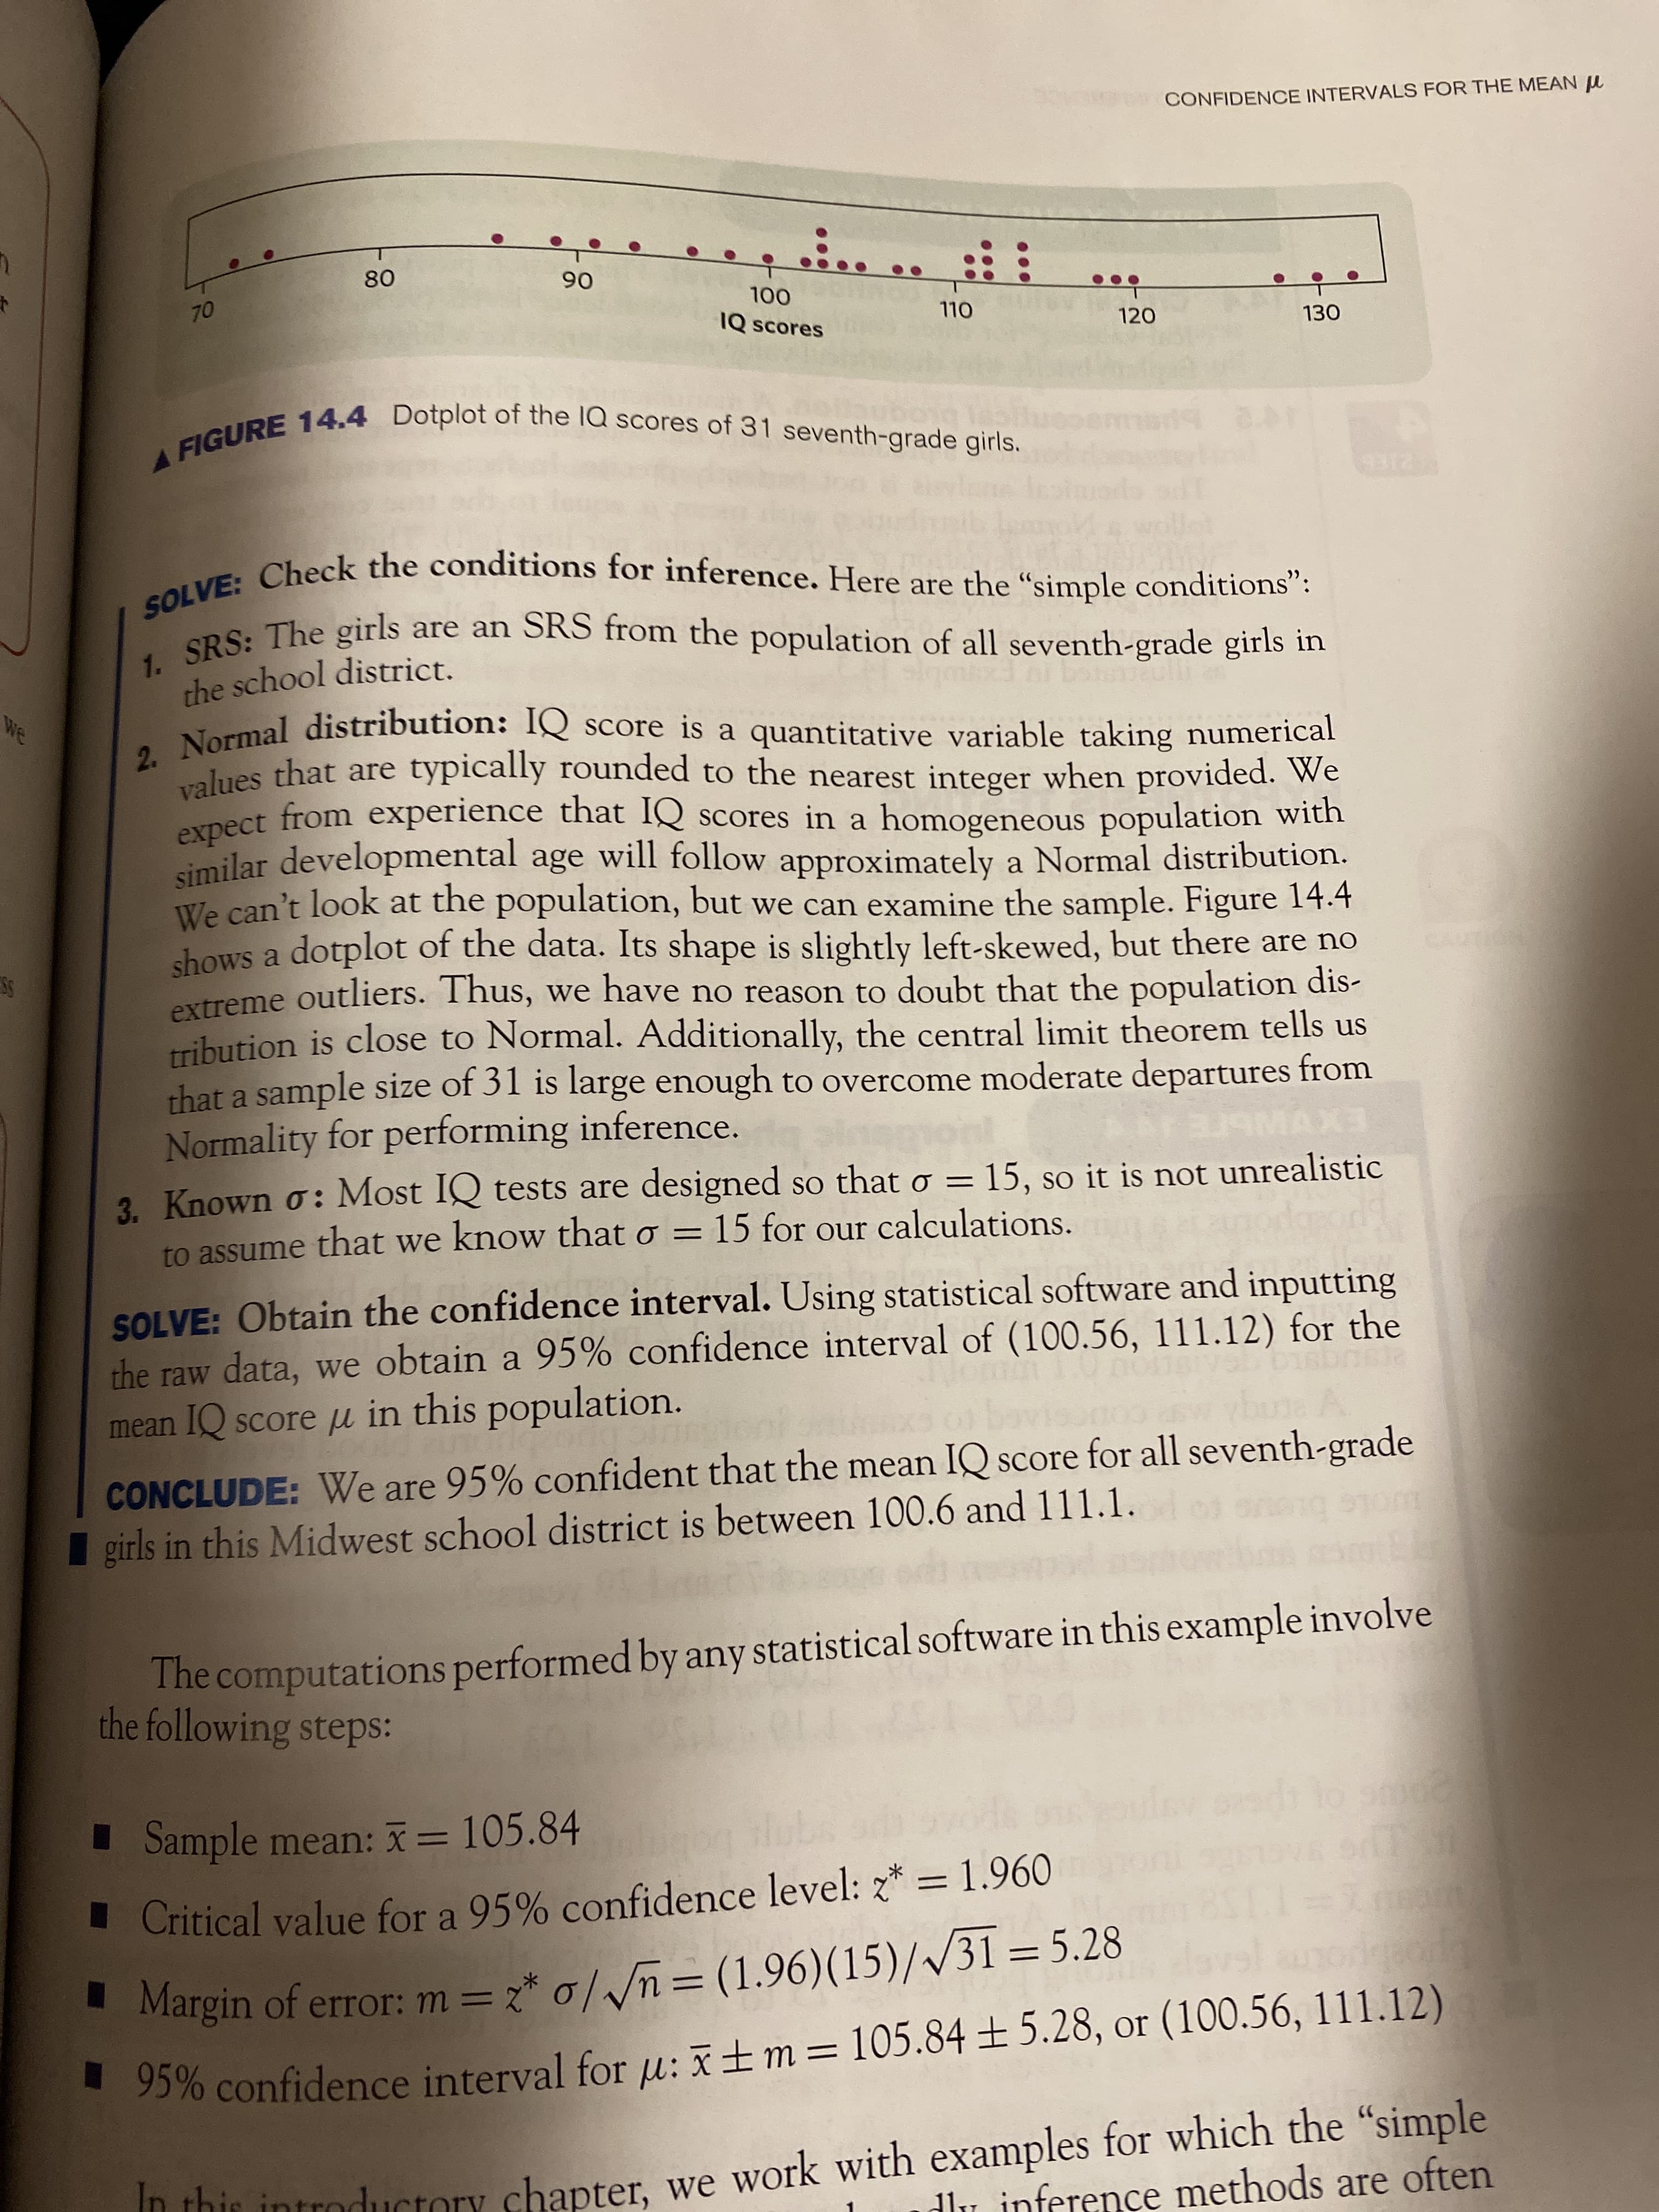
CURE 14.4 Dotplot of thne la scores of 31 seventh-grade girls.
. Check the conditions for inference. Here are the “simple conditions":
PS: The girls are an SRS from the population of all seventh-grade girls in
the school district.
lues that are typically rounded to the nearest integer when provided. We
eYpect from experience that IQ scores in a homogeneous population with
similar developmental age will follow approximately a Normal distribution.
We can't look at the population, but we can examine the sample. Figure 14.4
shows a dotplot of the data. Its shape is slightly left-skewed, but there are no
extreme outliers. Thus, we have no reason to doubt that the population dis-
Tribution is close to Normal. Additionally, the central limit theorem tells us
that a sample size of 31 is large enough to overcome moderate departures from
Normality for performing inference.
STE A
EXVN
3. Known o: Most IQ tests are designed so that o = 15, so it is not unrealistic
to assume that we know that o = 15 for our calculations.
SOLVE: Obtain the confidence interval. Using statistical software and inputting
the raw data, we obtain a 95% confidence interval of (100.56, 111.12) for the
mean IQ score u in this population.
CONCLUDE: We are 95% confident that the mean IQ score for all seventh-grade
girls in this Midwest school district is between 100.6 and 111.1.
The computations performed by any statistical software in this example involve
the following steps:
Sample mean: I = 105.84
Critical value for a 95% confidence level: 2* =1.960
%3D
Margin of error: m = 2* o//n= (1.96)(15)//31 =5.28
%3D
* 5% confidence interval for u:±m=105.84 ±5.28, or (100.56, 111.12)
n thir introductory chapter, we work with examples for which the "simple
dlu inference methods are often
Transcribed Image Text:APPLY YOUR KNOWLEDGE
14.4 Critical value and confidence level. This section provided the Normal crie
ical values z* for three commonly used confidence levels (90%, 95%, and 99%)
Explain briefly why the critical value must be larger for a larger confidence level
14.5 Pharmaceutical production. A manufacturer of pharmaceutical products ana-
lyzes each batch of a product to verify the concentration of the active ingredient.
The chemical analysis is not perfectly precise. In fact, repeated measurements
follow a Normal distribution with mean u equal to the true concentration and
with standard deviation o = 0.0068 grams per liter (g/l). Three analyses of one
batch give concentrations of 0.8403, 0.8363, and 0.8447 g/l. To estimate the true
concentration, give a 95% confidence interval for u. Follow the four-step process
as illustrated in Example 14.3.
loordba
bsh
HYPOTHESIS TESTING
Confidence intervals are one of the two most common types of statistical infe
ence. Use a confidence interval when your goal is to estimate a population parar
eter. Another common type of inference, called hypothesis tests (or sometim
Expert Solution
Step 1
Solution:
Let X be the concentration.
The given data for X is 0.8403, 0.8363 and 0.8447.

Trending now
This is a popular solution!

Step by step
Solved in 5 steps with 5 images

Recommended textbooks for you
Glencoe Algebra 1, Student Edition, 9780079039897…
Algebra
ISBN:
9780079039897
Author:
Carter
Publisher:
McGraw Hill
Glencoe Algebra 1, Student Edition, 9780079039897…
Algebra
ISBN:
9780079039897
Author:
Carter
Publisher:
McGraw Hill