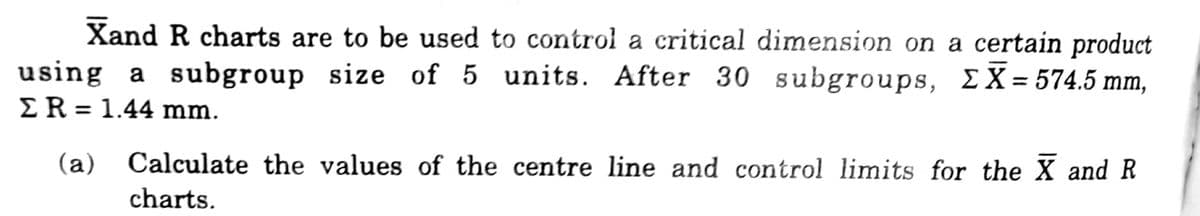
Xand R charts are to be used to control a critical dimension on a certain product using a subgroup size of 5 units. After 30 subgroups, EX = 574.5 mm, ER = 1.44 mm. (a) Calculate the values of the centre line and control limits for the X and R charts
Xand R charts are to be used to control a critical dimension on a certain product using a subgroup size of 5 units. After 30 subgroups, EX = 574.5 mm, ER = 1.44 mm. (a) Calculate the values of the centre line and control limits for the X and R charts

Algebra & Trigonometry with Analytic Geometry
13th Edition
ISBN:9781133382119
Author:Swokowski
Publisher:Swokowski
Chapter9: Systems Of Equations And Inequalities
Section: Chapter Questions
Problem 12T

Related questions
Question
100%
Transcribed Image Text:Xand R charts are to be used to control a critical dimension on a certain product
using a subgroup size of 5 units. After 30 subgroups, EX=574.5 mm,
ER = 1.44 mm.
(a) Calculate the values of the centre line and control limits for the X and R
charts.
Expert Solution
This question has been solved!
Explore an expertly crafted, step-by-step solution for a thorough understanding of key concepts.

Step by step
Solved in 2 steps with 2 images

Recommended textbooks for you
Algebra & Trigonometry with Analytic Geometry
Algebra
ISBN:
9781133382119
Author:
Swokowski
Publisher:
Cengage
Algebra & Trigonometry with Analytic Geometry
Algebra
ISBN:
9781133382119
Author:
Swokowski
Publisher:
Cengage