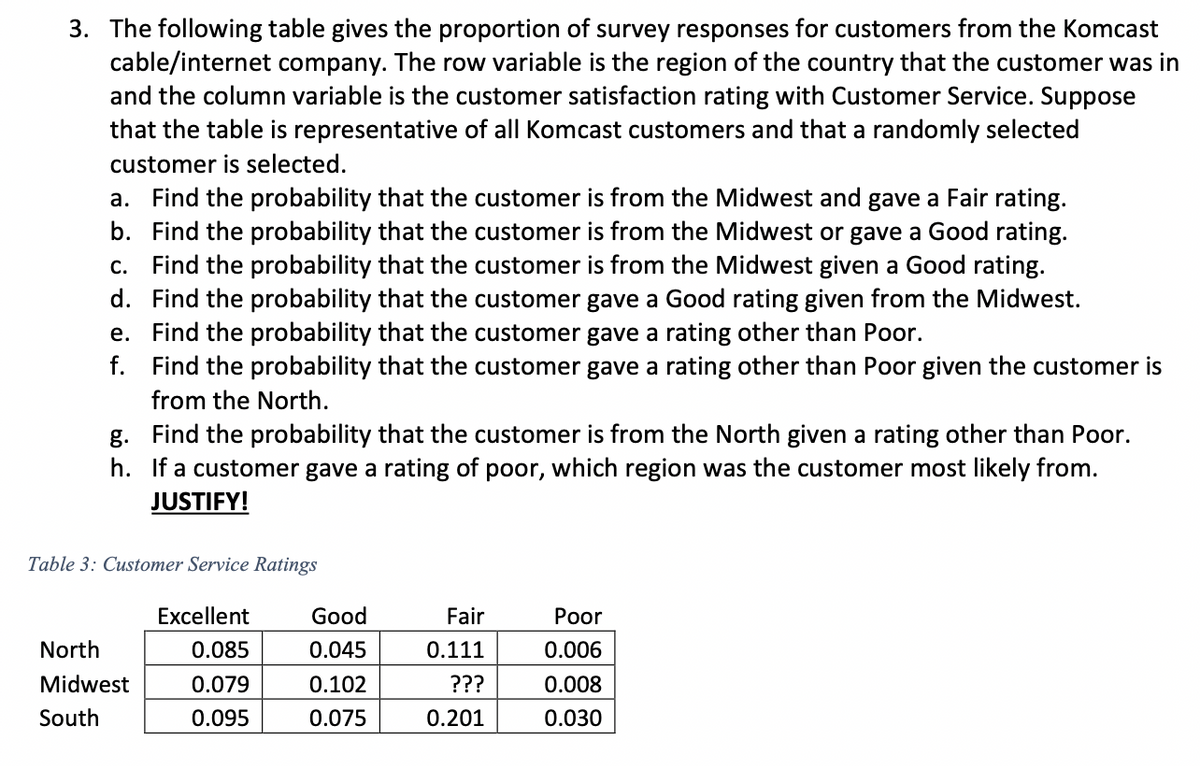
3. The following table gives the proportion of survey responses for customers from the Komcast cable/internet company. The row variable is the region of the country that the customer was in and the column variable is the customer satisfaction rating with Customer Service. Suppose that the table is representative of all Komcast customers and that a randomly selected customer is selected. a. Find the probability that the customer is from the Midwest and gave a Fair rating. b. Find the probability that the customer is from the Midwest or gave a Good rating. c. Find the probability that the customer is from the Midwest given a Good rating. d. Find the probability that the customer gave a Good rating given from the Midwest. e. Find the probability that the customer gave a rating other than Poor. f. Find the probability that the customer gave a rating other than Poor given the customer is from the North. g. Find the probability that the customer is from the North given a rating other than Poor. h. If a customer gave a rating of poor, which region was the customer most likely from. JUSTIFY! Table 3: Customer Service Ratings Excellent 0.085 0.079 0.095 North Midwest South Good 0.045 0.102 0.075 Fair 0.111 ??? 0.201 Poor 0.006 0.008 0.030
3. The following table gives the proportion of survey responses for customers from the Komcast cable/internet company. The row variable is the region of the country that the customer was in and the column variable is the customer satisfaction rating with Customer Service. Suppose that the table is representative of all Komcast customers and that a randomly selected customer is selected. a. Find the probability that the customer is from the Midwest and gave a Fair rating. b. Find the probability that the customer is from the Midwest or gave a Good rating. c. Find the probability that the customer is from the Midwest given a Good rating. d. Find the probability that the customer gave a Good rating given from the Midwest. e. Find the probability that the customer gave a rating other than Poor. f. Find the probability that the customer gave a rating other than Poor given the customer is from the North. g. Find the probability that the customer is from the North given a rating other than Poor. h. If a customer gave a rating of poor, which region was the customer most likely from. JUSTIFY! Table 3: Customer Service Ratings Excellent 0.085 0.079 0.095 North Midwest South Good 0.045 0.102 0.075 Fair 0.111 ??? 0.201 Poor 0.006 0.008 0.030

Glencoe Algebra 1, Student Edition, 9780079039897, 0079039898, 2018
18th Edition
ISBN:9780079039897
Author:Carter
Publisher:Carter
Chapter10: Statistics
Section10.6: Summarizing Categorical Data
Problem 10CYU

Related questions
Question
Transcribed Image Text:3. The following table gives the proportion of survey responses for customers from the Komcast
cable/internet company. The row variable is the region of the country that the customer was in
and the column variable is the customer satisfaction rating with Customer Service. Suppose
that the table is representative of all Komcast customers and that a randomly selected
customer is selected.
a. Find the probability that the customer is from the Midwest and gave a Fair rating.
b. Find the probability that the customer is from the Midwest or gave a Good rating.
c. Find the probability that the customer is from the Midwest given a Good rating.
d. Find the probability that the customer gave a Good rating given from the Midwest.
e. Find the probability that the customer gave a rating other than Poor.
f.
Find the probability that the customer gave a rating other than Poor given the customer is
from the North.
g. Find the probability that the customer is from the North given a rating other than Poor.
h. If a customer gave a rating of poor, which region was the customer most likely from.
JUSTIFY!
Table 3: Customer Service Ratings
Excellent
0.085
0.079
0.095
North
Midwest
South
Good
0.045
0.102
0.075
Fair
0.111
???
0.201
Poor
0.006
0.008
0.030
Expert Solution
This question has been solved!
Explore an expertly crafted, step-by-step solution for a thorough understanding of key concepts.

This is a popular solution!

Trending now
This is a popular solution!

Step by step
Solved in 4 steps with 4 images

Recommended textbooks for you
Glencoe Algebra 1, Student Edition, 9780079039897…
Algebra
ISBN:
9780079039897
Author:
Carter
Publisher:
McGraw Hill

Glencoe Algebra 1, Student Edition, 9780079039897…
Algebra
ISBN:
9780079039897
Author:
Carter
Publisher:
McGraw Hill