Do the poor spend more time in the shower than the rich? The results of a survey asking poor and rich people how many minutes they spend in the shower are shown below. Poor 18 10 14 38 18 33 38 14 30 29 8 Rich: 10 3 16 19 24 5 8 17 21 5 23 Assume both follow a Normal distribution. What can be concluded at the the a = 0.05 level of significance level of significance? For this study, we should use Select an answer a. The null and alternative hypotheses would be: Ho: Select an answer Select an answer Select an answer ✓ Select an answer ✓ H₁: b. The test statistic ? ✓ = = (please enter a decimal) Select an answer (Please enter a decimal) c. The p-value d. The p-value is ? ✓ a e. Based on this, we should f. Thus, the final conclusion is that ... Select an answer (please show your answer to 3 decimal places.) (Please show your answer to 4 decimal places.) Select an answer the null hypothesis. O The results are statistically insignificant at a = 0.05, so there is insufficient evidence to conclude that the population mean time in the shower for the poor is more than the population mean time in the shower for the rich. The results are statistically insignificant at a = 0.05, so there is statistically significant evidence to conclude that the population mean time in the shower for the poor is equal to the population mean time in the shower for the rich. O The results are statistically significant at a = 0.05, so there is sufficient evidence to conclude that the population mean time in the shower for the poor is more than the population mean time in the shower for the rich. The results are statistically significant at a = 0.05, so there is sufficient evidence to conclude that the mean time in the shower for the eleven poor people that were surveyed is more than the mean time in the shower for the eleven rich people that were surveyed.
Do the poor spend more time in the shower than the rich? The results of a survey asking poor and rich people how many minutes they spend in the shower are shown below. Poor 18 10 14 38 18 33 38 14 30 29 8 Rich: 10 3 16 19 24 5 8 17 21 5 23 Assume both follow a Normal distribution. What can be concluded at the the a = 0.05 level of significance level of significance? For this study, we should use Select an answer a. The null and alternative hypotheses would be: Ho: Select an answer Select an answer Select an answer ✓ Select an answer ✓ H₁: b. The test statistic ? ✓ = = (please enter a decimal) Select an answer (Please enter a decimal) c. The p-value d. The p-value is ? ✓ a e. Based on this, we should f. Thus, the final conclusion is that ... Select an answer (please show your answer to 3 decimal places.) (Please show your answer to 4 decimal places.) Select an answer the null hypothesis. O The results are statistically insignificant at a = 0.05, so there is insufficient evidence to conclude that the population mean time in the shower for the poor is more than the population mean time in the shower for the rich. The results are statistically insignificant at a = 0.05, so there is statistically significant evidence to conclude that the population mean time in the shower for the poor is equal to the population mean time in the shower for the rich. O The results are statistically significant at a = 0.05, so there is sufficient evidence to conclude that the population mean time in the shower for the poor is more than the population mean time in the shower for the rich. The results are statistically significant at a = 0.05, so there is sufficient evidence to conclude that the mean time in the shower for the eleven poor people that were surveyed is more than the mean time in the shower for the eleven rich people that were surveyed.

Glencoe Algebra 1, Student Edition, 9780079039897, 0079039898, 2018
18th Edition
ISBN:9780079039897
Author:Carter
Publisher:Carter
Chapter10: Statistics
Section10.4: Distributions Of Data
Problem 19PFA

Related questions
Question
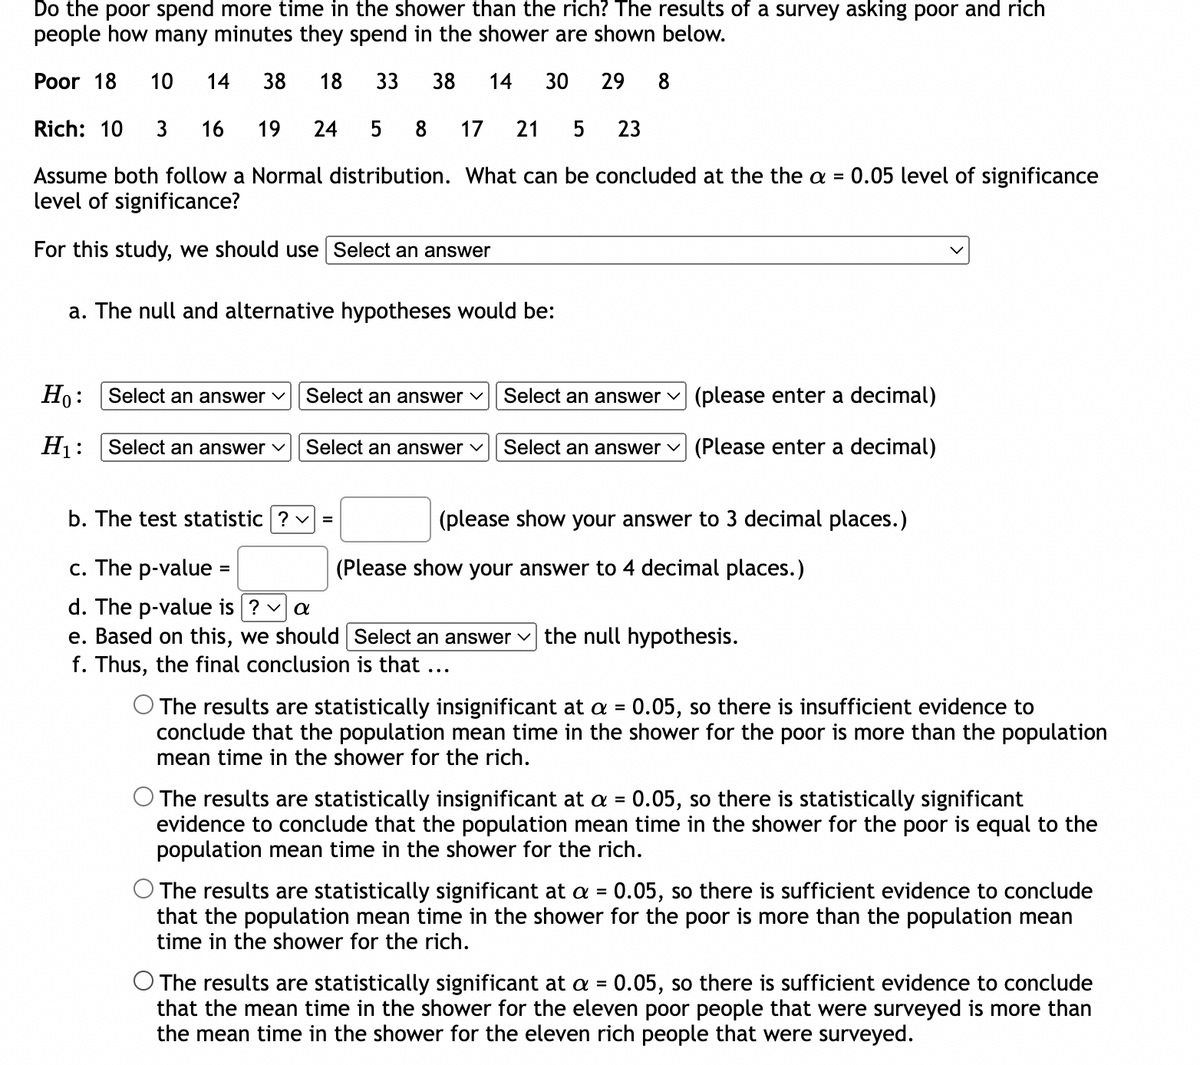
Transcribed Image Text:Do the poor spend more time in the shower than the rich? The results of a survey asking poor and rich
people how many minutes they spend in the shower are shown below.
Poor 18 10 14 38 18 33 38
14 30 29 8
Rich: 10 3 16 19 24 5 8 17 21 5 23
Assume both follow a Normal distribution. What can be concluded at the the a = 0.05 level of significance
level of significance?
For this study, we should use Select an answer
a. The null and alternative hypotheses would be:
Ho: Select an answer Select an answer
Select an answer ✓ Select an answer ✓
H₁:
b. The test statistic ? ✓ =
=
(please enter a decimal)
Select an answer (Please enter a decimal)
c. The p-value
d. The p-value is ? ✓ a
e. Based on this, we should
f. Thus, the final conclusion is that ...
Select an answer
(please show your answer to 3 decimal places.)
(Please show your answer to 4 decimal places.)
Select an answer the null hypothesis.
O The results are statistically insignificant at a = 0.05, so there is insufficient evidence to
conclude that the population mean time in the shower for the poor is more than the population
mean time in the shower for the rich.
The results are statistically insignificant at a = 0.05, so there is statistically significant
evidence to conclude that the population mean time in the shower for the poor is equal to the
population mean time in the shower for the rich.
O The results are statistically significant at a = 0.05, so there is sufficient evidence to conclude
that the population mean time in the shower for the poor is more than the population mean
time in the shower for the rich.
The results are statistically significant at a = 0.05, so there is sufficient evidence to conclude
that the mean time in the shower for the eleven poor people that were surveyed is more than
the mean time in the shower for the eleven rich people that were surveyed.
Expert Solution
This question has been solved!
Explore an expertly crafted, step-by-step solution for a thorough understanding of key concepts.

Step by step
Solved in 3 steps with 3 images

Recommended textbooks for you
Glencoe Algebra 1, Student Edition, 9780079039897…
Algebra
ISBN:
9780079039897
Author:
Carter
Publisher:
McGraw Hill
Glencoe Algebra 1, Student Edition, 9780079039897…
Algebra
ISBN:
9780079039897
Author:
Carter
Publisher:
McGraw Hill