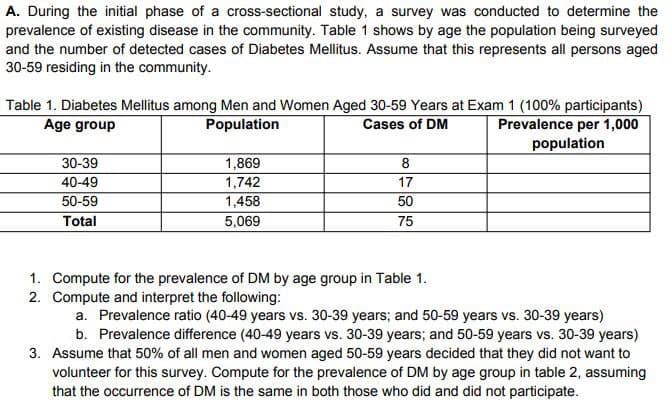
A. During the initial phase of a cross-sectional study, a survey was conducted to determine the prevalence of existing disease in the community. Table 1 shows by age the population being surveyed and the number of detected cases of Diabetes Mellitus. Assume that this represents all persons aged 30-59 residing in the community. Table 1. Diabetes Mellitus among Men and Women Aged 30-59 Years at Exam 1 (100% participants) Age group Population Cases of DM Prevalence per 1,000 population 30-39 40-49 50-59 Total 1,869 1,742 1,458 5,069 8 17 50 75 1. Compute for the prevalence of DM by age group in Table 1. 2. Compute and interpret the following: a. Prevalence ratio (40-49 years vs. 30-39 years; and 50-59 years vs. 30-39 years) b. Prevalence difference (40-49 years vs. 30-39 years; and 50-59 years vs. 30-39 years) 3. Assume that 50% of all men and women aged 50-59 years decided that they did not want to volunteer for this survey. Compute for the prevalence of DM by age group in table 2, assuming that the occurrence of DM is the same in both those who did and did not participate.
A. During the initial phase of a cross-sectional study, a survey was conducted to determine the prevalence of existing disease in the community. Table 1 shows by age the population being surveyed and the number of detected cases of Diabetes Mellitus. Assume that this represents all persons aged 30-59 residing in the community. Table 1. Diabetes Mellitus among Men and Women Aged 30-59 Years at Exam 1 (100% participants) Age group Population Cases of DM Prevalence per 1,000 population 30-39 40-49 50-59 Total 1,869 1,742 1,458 5,069 8 17 50 75 1. Compute for the prevalence of DM by age group in Table 1. 2. Compute and interpret the following: a. Prevalence ratio (40-49 years vs. 30-39 years; and 50-59 years vs. 30-39 years) b. Prevalence difference (40-49 years vs. 30-39 years; and 50-59 years vs. 30-39 years) 3. Assume that 50% of all men and women aged 50-59 years decided that they did not want to volunteer for this survey. Compute for the prevalence of DM by age group in table 2, assuming that the occurrence of DM is the same in both those who did and did not participate.

Functions and Change: A Modeling Approach to College Algebra (MindTap Course List)
6th Edition
ISBN:9781337111348
Author:Bruce Crauder, Benny Evans, Alan Noell
Publisher:Bruce Crauder, Benny Evans, Alan Noell
Chapter5: A Survey Of Other Common Functions
Section5.3: Modeling Data With Power Functions
Problem 6E: Urban Travel Times Population of cities and driving times are related, as shown in the accompanying...

Related questions
Question
Answer Question #3
Transcribed Image Text:A. During the initial phase of a cross-sectional study, a survey was conducted to determine the
prevalence of existing disease in the community. Table 1 shows by age the population being surveyed
and the number of detected cases of Diabetes Mellitus. Assume that this represents all persons aged
30-59 residing in the community.
Table 1. Diabetes Mellitus among Men and Women Aged 30-59 Years at Exam 1 (100% participants)
Age group
Population
Cases of DM
Prevalence per 1,000
population
30-39
40-49
50-59
Total
1,869
1,742
1,458
5,069
8
17
50
75
1.
Compute for the prevalence of DM by age group in Table 1.
2. Compute and interpret the following:
a. Prevalence ratio (40-49 years vs. 30-39 years; and 50-59 years vs. 30-39 years)
b. Prevalence difference (40-49 years vs. 30-39 years; and 50-59 years vs. 30-39 years)
3. Assume that 50% of all men and women aged 50-59 years decided that they did not want to
volunteer for this survey. Compute for the prevalence of DM by age group in table 2, assuming
that the occurrence of DM is the same in both those who did and did not participate.
Expert Solution
This question has been solved!
Explore an expertly crafted, step-by-step solution for a thorough understanding of key concepts.

Step by step
Solved in 5 steps

Recommended textbooks for you
Functions and Change: A Modeling Approach to Coll…
Algebra
ISBN:
9781337111348
Author:
Bruce Crauder, Benny Evans, Alan Noell
Publisher:
Cengage Learning

Glencoe Algebra 1, Student Edition, 9780079039897…
Algebra
ISBN:
9780079039897
Author:
Carter
Publisher:
McGraw Hill
Functions and Change: A Modeling Approach to Coll…
Algebra
ISBN:
9781337111348
Author:
Bruce Crauder, Benny Evans, Alan Noell
Publisher:
Cengage Learning
Glencoe Algebra 1, Student Edition, 9780079039897…
Algebra
ISBN:
9780079039897
Author:
Carter
Publisher:
McGraw Hill