How many voters should be sampled for a 99% confidence interval? Round up to the nearest whole number.


Q: 15 10 5 -5 -10 -15 -20 65 70 75 80 85 Other 00 90 95 00 05 10 15 0 20
A: The graph of the data is given.
Q: Answer the following questions. You may use R on your own computer. 1) [ State the assumption of…
A: In the given model, the dependent variable is average credit card balance which is studied using an…
Q: each of the following sampling scenarios, choose an appropriate test statistic for our hypothesis…
A: Answer Given Mean = 578 Standard deviation = 75
Q: Please use literature and provide the pros and cons
A: The "Bp test" is not a standard statistical test or acronym commonly used in statistical analysis.…
Q: Percentage variance and turkey HSD
A: For this problem, we need to use the ANOVA (Analysis of Variance) test to examine if there are any…
Q: Find the margin of error for the 95% confidence interval used to estimate the population proportion.…
A: Given that n= 2440p^=70%=0.7 The confidence level is 95% confidence level.Significance…
Q: The 99% confidence interval for the mean difference (A – B) in the time it takes to experience…
A: The 99% confidence interval for the mean difference (A – B) in the time it takes to experience…
Q: Finding Probabilities in Normal Distributions Weekly salaries of college students in a large city…
A: Answer:- Given, Mean, µ = 540 Standard deviation, σ = 45 Let X be a random variable represents the…
Q: What is the probability that a randomly chosen customer ordered no dish at all? TYPE YOUR ANSWER AS…
A: Here Given No of customer = 100 n(A)= 22 n(B)=23 n(C)= 19 n(A ∩ B) = 13 n( A ∩ C) = 7 n( B ∩ C) = 9…
Q: Fill the Following blanks with the right answer! □ PIZ-1.39)= @ P(Z > 1₁96) = Plo. 65 17)
A:
Q: Please no written by hand solution 1) Suppose you want to know the percentage of university…
A: As per the Bartleby guildlines we have to solve first question and rest can be reposted....…
Q: Find the margin of error for the given values of c, s, and n.
A: Given that, c=0.95α=1-C=1-0.95=0.05s=3.3n=16 To find the margin of error (E).
Q: The amount of time to complete a physical activity in a PE class is approximately normally normally…
A: normal distribution μ=34σ=5.4(a) P(x<31.5)=?(b)P(x>38.3)=?
Q: Suppose the PDF of X is given by fx(x) = 5e-³×(₁)(x). Find its CDF.
A:
Q: A sample of 150 married women determined that 127 are happy in their marriage. A sample of 150…
A: n1=150, n2=150 As per our guidelines I can solve only first 3 subparts. Post the remaining subparts…
Q: Looking at the table below what do you conclude in a test of weekly expenditure on fruit between…
A: Given hypothesis: Testing the null hypothesis of no difference against a 1-sided alternative that…
Q: a.) How do you define the maximum credibility of the parameter theta estimate if the credibility…
A: a)- The maximum credibility of the parameter theta estimate is defined as the value of theta that…
Q: A county real estate appraiser wants to develop a statistical model to predict the appraised value…
A: The given regression equation is y^=74.80+17.80x.
Q: 2) The volume, Lliters of emulsion Paint in a Plastic tub may be assumed to be normally distributed…
A: X~N(10.25 ,σ) and P(X>10)=98% Find value of σ
Q: In applying statistics, we make decisions with less than 100% certainty (We are not always correct…
A: In applying statistics, we make decisions with less than 100% certainty (We are not always correct…
Q: For the standard normal curve, find the z-score that corresponds to the 7th decile
A: standard normal distribution Z~N(0,1) find z score correspond to 7th decile
Q: Construct a frequency distribution and a frequency histogram for the data set using the indicated…
A: The data for the reaction times of 30 adult females are given.
Q: You are conducting a study to see if the proportion of women over 40 who regularly have mammograms…
A: Answer:- Given, The test statistic is, z = 2.61, The test is right-tailed test. We use standard…
Q: How did we get the 0.1828 and 0.2056?
A: Sample size (n)=2400 Sue select 81 sample and Javier select 64 The formula for 100(1-α)% confidence…
Q: a population proportion of 0.61. Suppose a random sample of 662 items is sampled randomly from this…
A: As per above information they solve first three subparts , so I will solve remaining parts d and e.…
Q: Please no written by hand The driver of a diesel-powered automobile decided to test the quality of…
A:
Q: METHODS AND APPLICATIONS Sound City sells the ClearTone-400 satellite car radio. For this radio,…
A: Given that, from the given information Radio(x) week P(x) 0 2…
Q: 1) The data set "Boston" contains medv (median value of owner-occupied homes in $1000s) and 1stat…
A: A R programming problem is given here in which the data set Boston is taken. The dependent variable…
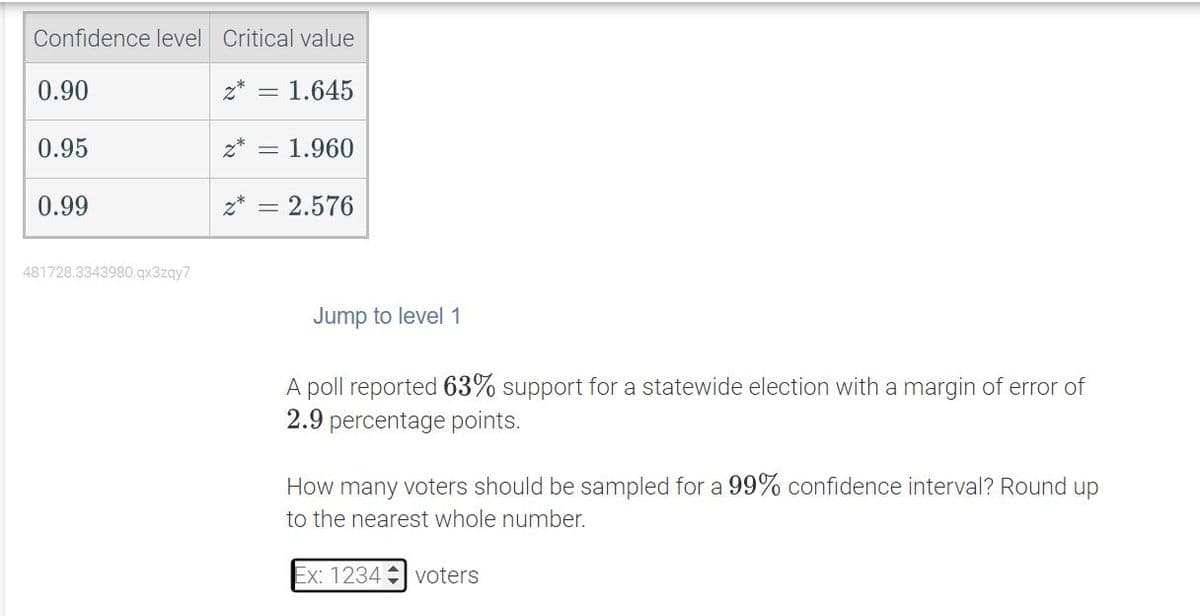
Q: Find the margin of error for the given values of c, o, and n. c = 0.90, o = 2.9, n = 81 Click the…
A: From the provided information, c = 0.90, σ = 2.9, n = 81
Q: One ticket will be drawn at random from the box below. Are the first and second numbers independent?…
A: One ticket will be drawn at random from the box below. [ (3, 1) , ( 3, 1) , (3, 8) , (5, 1) , (5, 1)…
Q: Difference of Two Proportions Problem. Significance magazine had an article looking at the impact on…
A: The required formula is,
Q: What is the point estimate? 90% confidence interval, p.12, n 50 01.11 O 12 03 094
A: p̂ = 0.12 N = 50
Q: A record of a chess match records the chess piece used, the location of the piece and the length of…
A: The variables are: piece, location and the move time.
Q: Use a stem-and-leaf plot to display the data, which represent the numbers of hours 24 nurses work…
A: Answer:- Given data in ascending order, 26, 29, 30, 32, 32, 33, 35, 36, 36, 36, 36, 38, 38, 40, 40,…
Q: Question 1 A teacher received many emails from students in a Mathematics class. The raw data are…
A: The question is about frequency distribution Given : To find : a ) How many emails did the…
Q: The mean weight baggage carried into an airplane by individual passengers at Clark International…
A: From the provided information, Sample size (n) = 1110 Sample mean (x̄) = 18.5 Sample standard…
Q: True or false The mean and variance of a Poisson distribution are same
A: Poisson distribution X~Poisson(λ)
Q: 14. Suppose you did a hypothesis test on a mean with the alternative Ha: 10, and found a P-value of…
A:
Q: A study was done to look at the relationship between number of vacation days employees take each…
A: The data is given as- x: vacation days y: sick days 3 4 13 0 1 10 6 1 12 0 1 6 13 0…
Q: he St. Louis Cardinals would like to improve their post season performance this year. They have…
A: Sampling plan , Data collection and using confidence intervals are discussed below
Q: Determine the area under the standard normal curve that lies to the right of Z = 1.45 The area of…
A: or a calculator with normal distribution functions to determine the area under the standard normal…
Q: (Type whole numbers.) Class Frequency 126-162 163-199 200-236 237-273 274-310 the data set using 5…
A: 169 157 126 130 179 161 166 220 142 133 194 209 151 257 260 248 306 139 204 181 Sample size n =20
Q: One of the questions in a study of marital satisfaction of dual-career couples was to rate the…
A: The question is about hypo. testing Given : To find : a ) null hypo. b ) alt. hypo. c ) r.v d )…
Q: True or False: A covariance coefficient is a symmetrical measure of association.
A: In the realm of statistics, measures of association play a crucial role in quantifying the…
Q: Let X ~t(30). Use tables to determine the values b, c such that P(-b≤X ≤ b) = 0.90; P(X > c) =…
A: We have given that, X~t30 i.e. The random variable X follows a t-distribution with 30 degrees of…
Q: Do these data indicate any significant differences among the three methods? Test with a = .05.
A: Anova is the measure used to determine the mean significant between the three or more groups. It is…
Q: A record of a chess match records the chess piece used, the location of the piece and the length of…
A: The variables are: chess piece used, the location of the piece and the length of time used to make…
Q: If X has the following probability distribution: Answer 8 and 9: 8). Find P(X-1)? A) 0.2 B) 0.1 9).…
A: Q-8) x -1 0 1 2 3 P(x) 0.2 0.3 b 0.2 0.2 P(x=1) = ? Q-9)variance of x = ?
Q: Suppose you are testing to see if your dog. Hope, understands pointing towards an object. You place…
A: Two objects are placed about 2.5 meters away, and you point towards one of the objects. Number of…
Q: X x1 x2 p(x) 0.6 0.4 In class, we showcase how to use the rejection sampling method with g(x) below…
A: In the given question, we are provided with a probability distribution function, p(x), defined over…
Can you please help with the answer to this question?


Trending now
This is a popular solution!

Step by step
Solved in 3 steps

- In a test of the effectiveness of garlic for lowering cholesterol, 25 patients were treated with raw garlic. The changes in their levels of LDL cholesterol (in mg/dL) had a mean of 0.4 and a standard deviation of 21.0. a. Find the margin of error E that corresponds to 98% confidence level. Round E to five decimal places. b. Find the 98% confidence interval estimate of the population mean. Follow rounding rules and use appropriate notation. c. What does the confidence interval suggest about the effectiveness of garlic in reducing LDL cholesterol?A random sample of 10 items is taken from a normal population. The sample had a mean of 82 and astandard deviation is 26. Which is the appropriate 99% confidence interval for the population mean?Create a 85% confidence interval for a population proportion from a sample of size 103 with sample proportion ˆpp^ = 4110341103. ( , ) [three decimal accuracy] [three decimal accuracy]
- Data from a survey of a representative sample was used to estimate that 33% of computer users in 2011 had tried to get on a Wi-Fi network that was not their own in order to save money. Suppose you decide to conduct a survey to estimate this proportion for the current year. What is the required sample size if you want to estimate this proportion with a margin of error of 0.05? (Assume a 95% confidence level.) Calculate the required sample size first using 0.33 as a preliminary estimate of p. (Round your answer up to the nearest whole number.) n = ?? Calculate the required sample size using the conservative value of 0.5. (Round your answer up to the nearest whole number.) n=??Given that the sample proportion of Americans who are dissatisfied with the quality of education is 0.53 and the sample size is 1012. a. Verify that the sample is large enough to use the normal formula to find a confidence interval for the proportion of Americans who are dissatisfied with the quality of education students receive in kindergarten through grade 12. b. Construct a 90% confidence interval for the proportion of U.S. adults who are dissatisfied with the quality of education students receive in kindergarten through grade 12. Use three decimal places in your margin of error. c. Provide an interpretation of your interval in the context of this data situation.The mean weight for college students is 175 pounds. A sample of 30 students at a college is taken, and the mean of the sample is 180 pounds with standard deviation 20 pounds. A company wants to see if the weights of the students at the college are statistically different from the national average at the 95% confidence level. Find the p-value in the table for the table value of t closest to the calculated value of the test statistic (round to 2 decimal places).
- A pack of whey powder is marked to have 30 grams. It was determined that the average mean weight content is 27.5 grams and a standard deviation of 0.9 grams. The bakery randomly selected 36 packs from the stock room. What is the standard error? Construct a 95% confidence interval, provide the margin of error Construct a 95% one-sided confidence bound, provide the margin of error Assuming that the population is normally distributed, test to see if the mean of the population is at least 30 grams. Use 0.01 level of significance. Applying the same hypotheses, use a 0.075 level of significance.The operations manager at a light emitting diode (LED) light bulb factory needs to estimatethe mean life of a large shipment of LEDs. The manufacturer’s specifications are that thestandard deviation is 1,500 hours. A random sample of 64 LEDs indicated a sample mean lifeof 49,875 hours.Construct a 95% confidence interval estimate for the population mean life of LED light bulbsin this shipment.Ans: CI = ______________________ Paste your working here:The freshness of produce at a super-store is rated on a scale of 1 to 5 with 5 being very fresh. Froma random sample of 49 customers, the average score was 3.8 with a standard deviation of 0.7. a) Obtain an 80% confidence interval for the population mean - the mean score for thedistribution of all possible customers. Specify and check all conditions needed for theproblem. b) Does the interval obtained in Part(a) contain the population mean score for the customers?Why? c) Does the interval obtained in Part(a) contain the sample mean score for the customers in thedata? Why? d.) In a long series of repeated experiments, with new random samples of 49 customers eachday, what proportion of the resulting confidence intervals will contain the true populationmean? Explain your reasoning.
- TOTAL PLASMA VOLUME IS IMPORTANT IN DETERMINING THE REQUIRED PLASMA COMPONENT IN BLOOD REPLACEMENT THERAPY FOR A PERSON UNDERGOING SURGERY. PLASMA VOLUME IS INFLUENCED BY THE OVERALL HEALTH AND PHYSICAL ACTIVITY OF AN INDIVIDUAL. SUPPOSE THAT A RANDOM SAMPLE OF 45 MALE FIREFIGHTERS ARE TESTED AND THAT THEY HAVE A PLASMA VOLUME SAMPLE MEAN OF 37.5ML/KG WITH A STANDARD DEVIATION OF 7.50ML/KG. 1) Find a 95% confidence interval for the mean blood plasma volume in male firefighters. Interpretthe interval. 2) The Chief Scientist at the lab wants the estimation of the mean blood plasma volume to be correctto within 1 unit of the true mean with 95% probability. How many additional firefighters have tobe sampled in order to achieve this estimation accuracy?A random sample of 100 observation produced a sample mean 22.3 and given population standard deviation 6. (b) find a 90% confidence interval for μ. Round to 2 decimal places.A look at all Ontario households using natural gas heating in 2012 shows that the mean monthly consumption of natural gas is 107.73 ft3, with a population standard deviation of 13.9a ft3. For a sample of 6a households, the sample mean found was 105.6a ft3. Use this information to find value, the margin of error E, and to construct a 93% confidence interval for the mean monthly consumption for the population of all Ontario households. Is this sample a good estimation of the population mean monthly consumption of natural gas for all Ontario households? (a=1)


