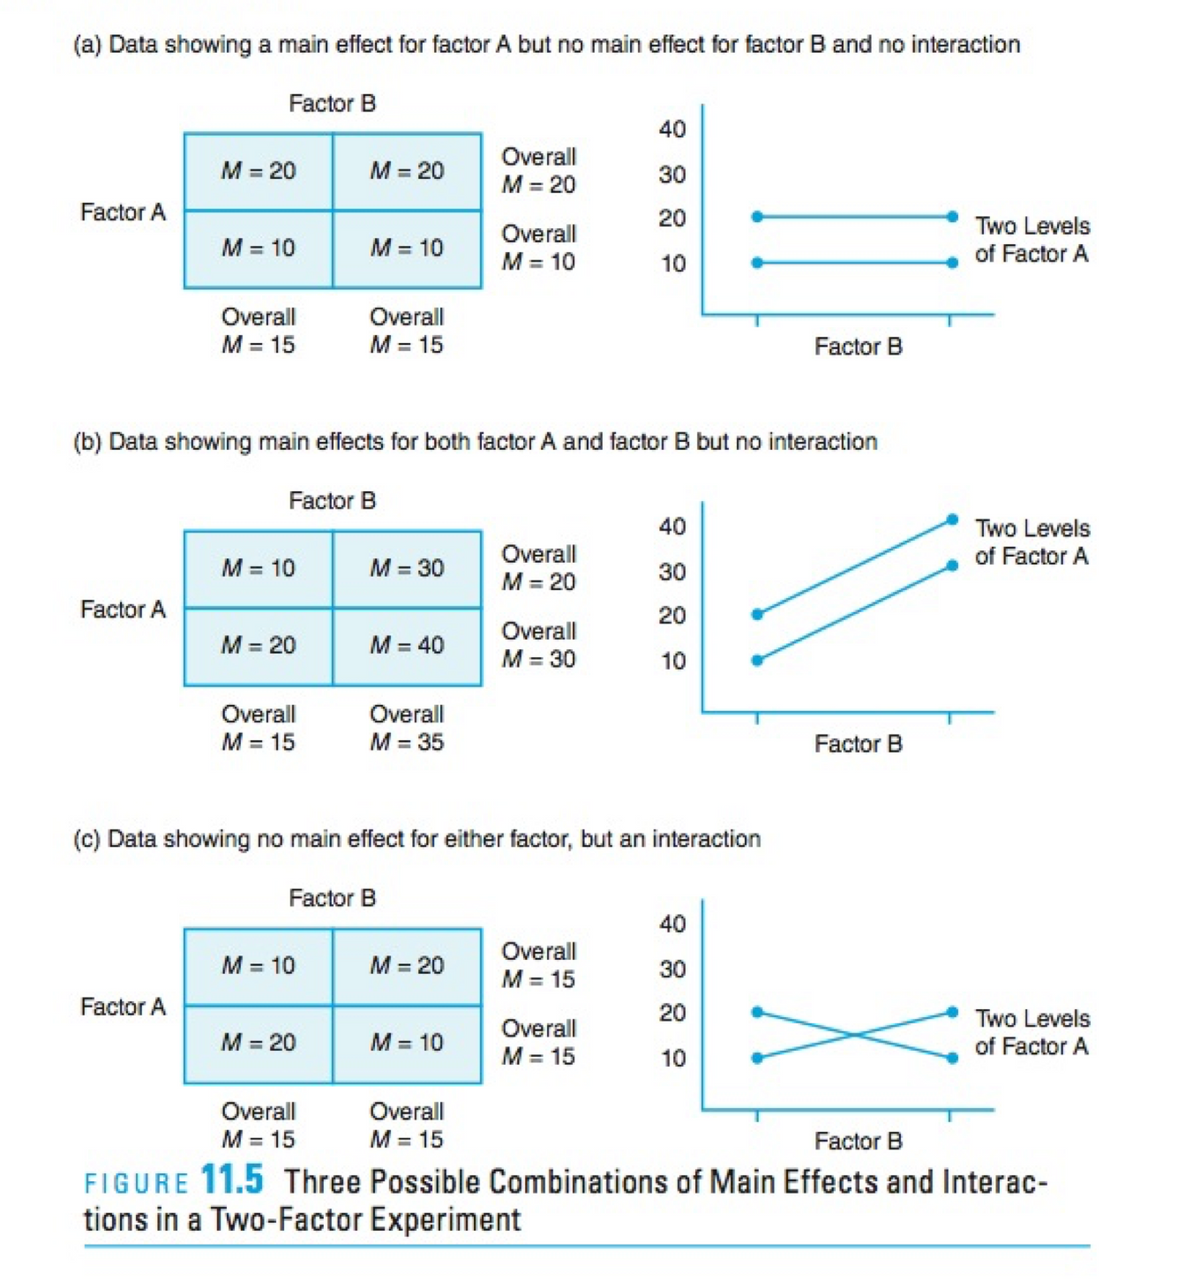
(a) Data showing a main effect for factor A but no main effect for factor B and no interaction Factor B 40 M = 20 Overall M = 20 = 20 30 %3D %3D Factor A 20 Overall Two Levels M = 10 M = 10 M = 10 of Factor A 10 Overall M = 15 Overall M = 15 Factor B (b) Data showing main effects for both factor A and factor B but no interaction Factor B 40 Two Levels of Factor A Overall M = 10 M = 30 M = 20 30 Factor A 20 M = 20 Overall M = 30 M = 40 10 Overall Overall M = 35 M = 15 Factor B (c) Data showing no main effect for either factor, but an interaction Factor B 40 Overall M = 10 M = 20 30 M = 15 Factor A 20 Two Levels of Factor A Overall M = 20 M = 10 M = 15 10 Overall Overall M = 15 M = 15 Factor B FIGURE 11.5 Three Possible Combinations of Main Effects and Interac- tions in a Two-Factor Experiment
(a) Data showing a main effect for factor A but no main effect for factor B and no interaction Factor B 40 M = 20 Overall M = 20 = 20 30 %3D %3D Factor A 20 Overall Two Levels M = 10 M = 10 M = 10 of Factor A 10 Overall M = 15 Overall M = 15 Factor B (b) Data showing main effects for both factor A and factor B but no interaction Factor B 40 Two Levels of Factor A Overall M = 10 M = 30 M = 20 30 Factor A 20 M = 20 Overall M = 30 M = 40 10 Overall Overall M = 35 M = 15 Factor B (c) Data showing no main effect for either factor, but an interaction Factor B 40 Overall M = 10 M = 20 30 M = 15 Factor A 20 Two Levels of Factor A Overall M = 20 M = 10 M = 15 10 Overall Overall M = 15 M = 15 Factor B FIGURE 11.5 Three Possible Combinations of Main Effects and Interac- tions in a Two-Factor Experiment

College Algebra (MindTap Course List)
12th Edition
ISBN:9781305652231
Author:R. David Gustafson, Jeff Hughes
Publisher:R. David Gustafson, Jeff Hughes
Chapter6: Linear Systems
Section6.2: Guassian Elimination And Matrix Methods
Problem 84E: Explain the differences between Gaussian elimination and Gauss-Jordan elimination.

Related questions
Question
100%
Please look at the picture and explain all three examples (a, b, c). Explain what is the main effect of factor A and factor B and why do we have/do not have interaction in each example
Transcribed Image Text:(a) Data showing a main effect for factor A but no main effect for factor B and no interaction
Factor B
40
M = 20
Overall
M = 20
= 20
30
%3D
%3D
Factor A
20
Overall
Two Levels
M = 10
M = 10
M = 10
of Factor A
10
Overall
M = 15
Overall
M = 15
Factor B
(b) Data showing main effects for both factor A and factor B but no interaction
Factor B
40
Two Levels
of Factor A
Overall
M = 10
M = 30
M = 20
30
Factor A
20
M = 20
Overall
M = 30
M = 40
10
Overall
Overall
M = 35
M = 15
Factor B
(c) Data showing no main effect for either factor, but an interaction
Factor B
40
Overall
M = 10
M = 20
30
M = 15
Factor A
20
Two Levels
of Factor A
Overall
M = 20
M = 10
M = 15
10
Overall
Overall
M = 15
M = 15
Factor B
FIGURE 11.5 Three Possible Combinations of Main Effects and Interac-
tions in a Two-Factor Experiment
Expert Solution
This question has been solved!
Explore an expertly crafted, step-by-step solution for a thorough understanding of key concepts.

This is a popular solution!

Trending now
This is a popular solution!

Step by step
Solved in 2 steps

Knowledge Booster


Learn more about
Need a deep-dive on the concept behind this application? Look no further. Learn more about this topic, statistics and related others by exploring similar questions and additional content below.Recommended textbooks for you
College Algebra (MindTap Course List)
Algebra
ISBN:
9781305652231
Author:
R. David Gustafson, Jeff Hughes
Publisher:
Cengage Learning
College Algebra (MindTap Course List)
Algebra
ISBN:
9781305652231
Author:
R. David Gustafson, Jeff Hughes
Publisher:
Cengage Learning