This is a Free Response question. You can either: 1) type in and show all your work in the textbox below OR 2) do all your written work on a scratch paper. If you choose this option, you can take pictures of all your work and upload it at the end of the exam using your phone. ***REGARDLESS OF WHAT OPTION YOU SELECT ABOVE, YOU MUST PUT YOUR FINAL ANSWERS IN THE BOX BELOW. FAILURE TO DO SO WILL RESULT IN A ZERO FOR THIS PROBLEM!*** Suppose we have scatter diagram for the heights of 3,000 pairs of fathers and sons. The summary statistics are: average height of fathers 70 inches SD-8 inches average height of sons 72 inches SD-4 inches, r 0.7 Find linear regression line for predicting height of the father(y variable) from the height of their sons(x variable). Use it to predict the height of a father whose son's height is 65 inches. For the toolbar, press ALT+F10 (PC) or ALT+FN+F10 (Mac). BIUS Paragraph Arial 10pt AV AV I XQ 52 E X² X₂G >11< ± RBC ST ΨΩΘ. 安安图 † (:) > BAD
This is a Free Response question. You can either: 1) type in and show all your work in the textbox below OR 2) do all your written work on a scratch paper. If you choose this option, you can take pictures of all your work and upload it at the end of the exam using your phone. ***REGARDLESS OF WHAT OPTION YOU SELECT ABOVE, YOU MUST PUT YOUR FINAL ANSWERS IN THE BOX BELOW. FAILURE TO DO SO WILL RESULT IN A ZERO FOR THIS PROBLEM!*** Suppose we have scatter diagram for the heights of 3,000 pairs of fathers and sons. The summary statistics are: average height of fathers 70 inches SD-8 inches average height of sons 72 inches SD-4 inches, r 0.7 Find linear regression line for predicting height of the father(y variable) from the height of their sons(x variable). Use it to predict the height of a father whose son's height is 65 inches. For the toolbar, press ALT+F10 (PC) or ALT+FN+F10 (Mac). BIUS Paragraph Arial 10pt AV AV I XQ 52 E X² X₂G >11< ± RBC ST ΨΩΘ. 安安图 † (:) > BAD

Linear Algebra: A Modern Introduction
4th Edition
ISBN:9781285463247
Author:David Poole
Publisher:David Poole
Chapter2: Systems Of Linear Equations
Section2.4: Applications
Problem 26EQ

Related questions
Question
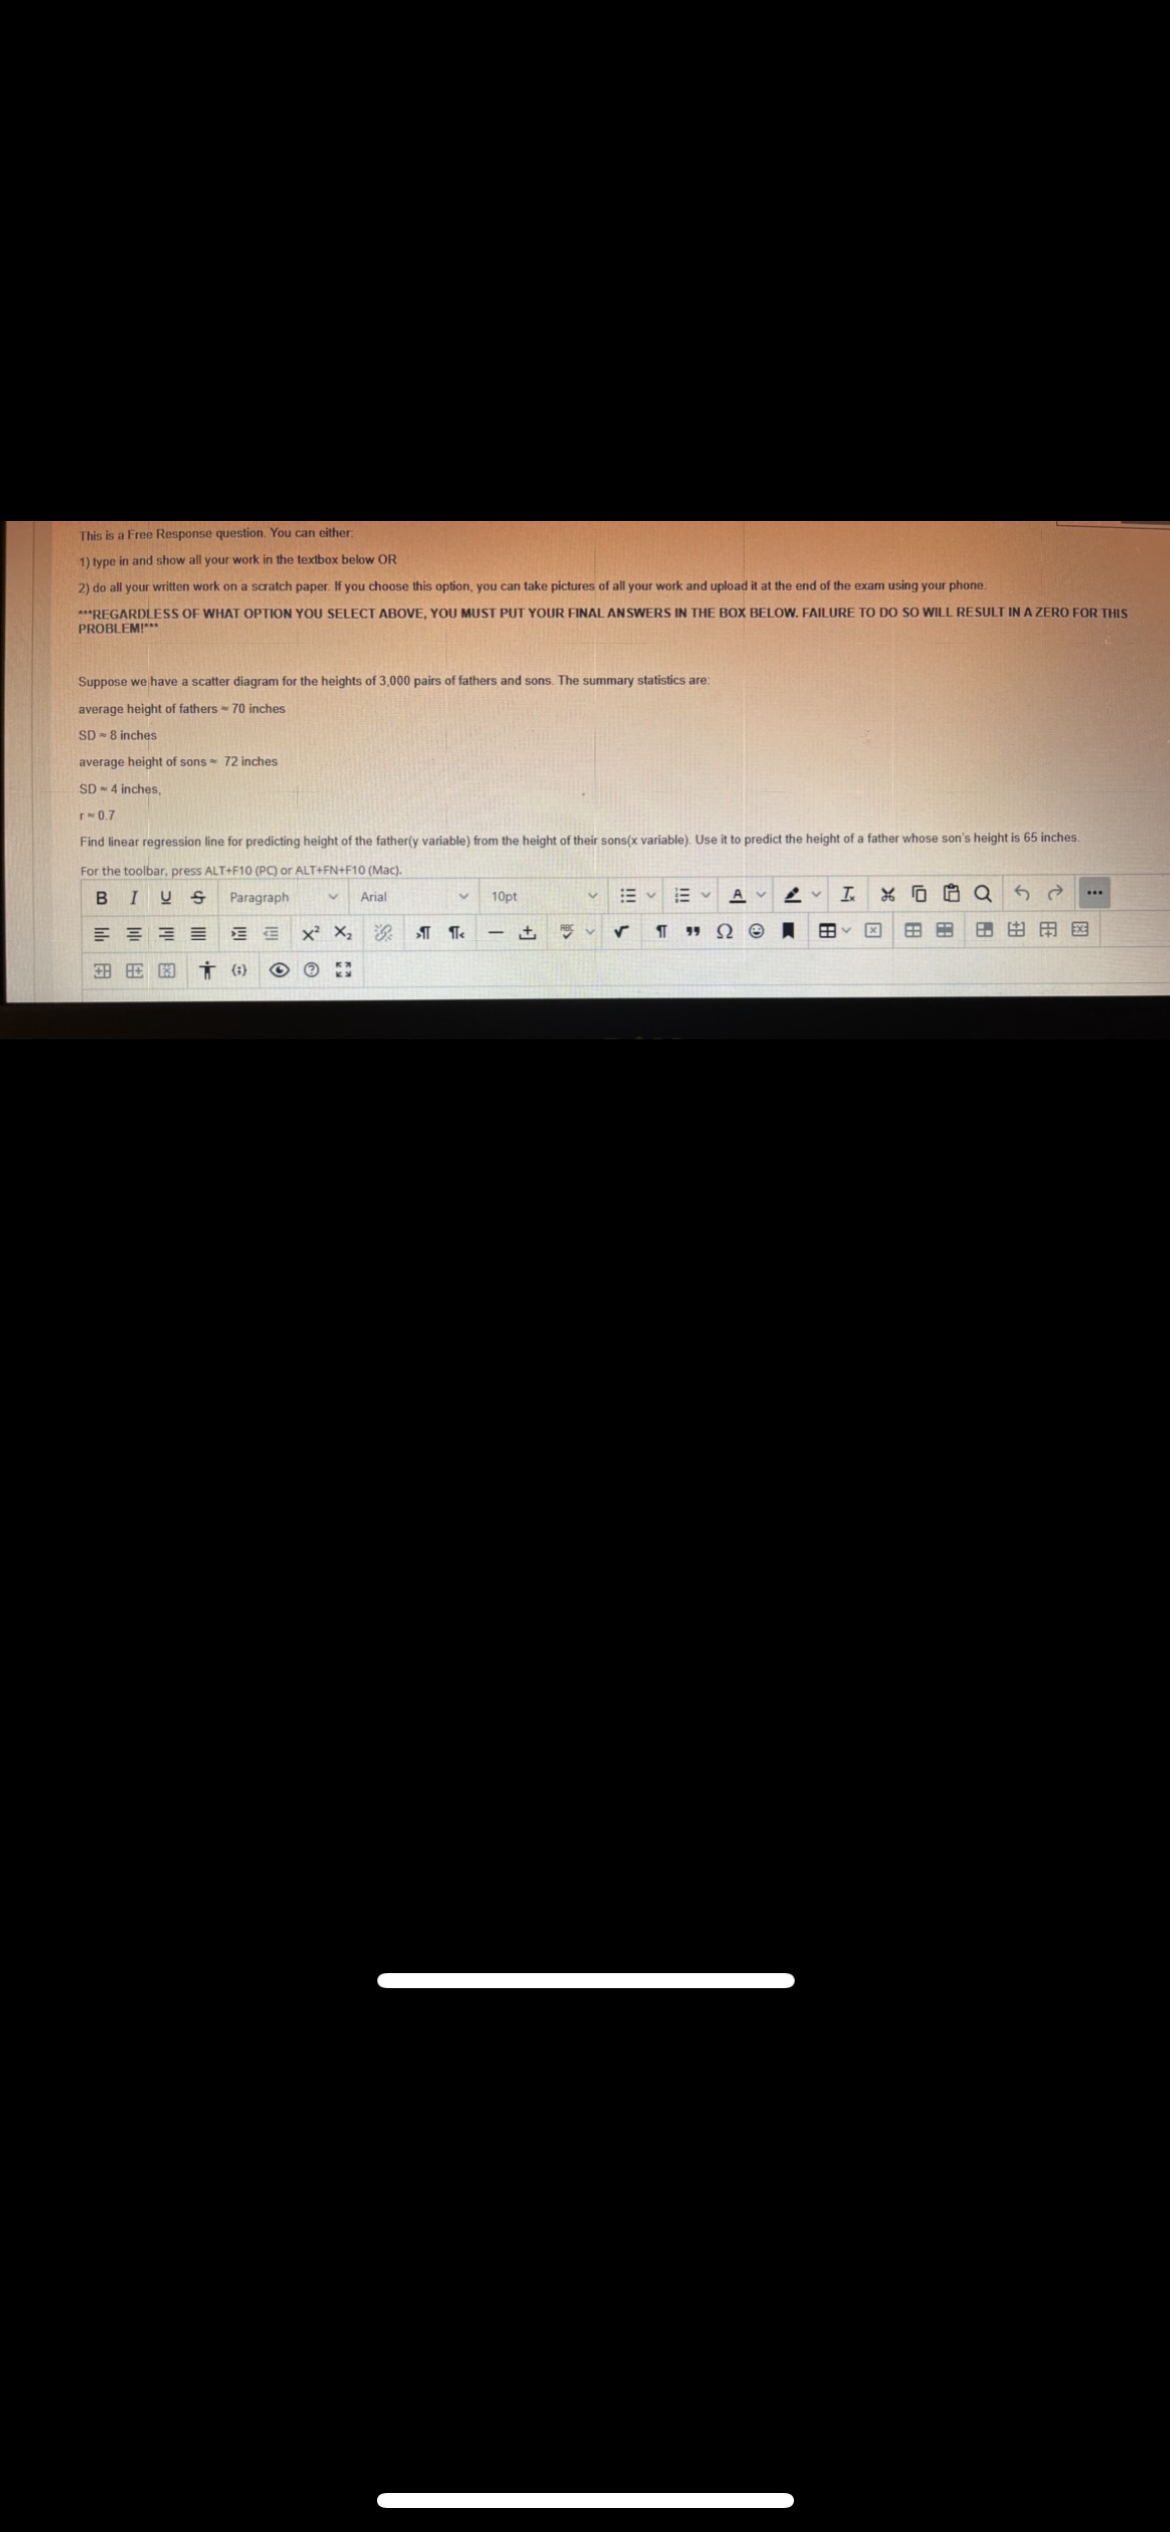
Transcribed Image Text:This is a Free Response question. You can either:
1) type in and show all your work in the textbox below OR
2) do all your written work on a scratch paper. If you choose this option, you can take pictures of all your work and upload it at the end of the exam using your phone.
***REGARDLESS OF WHAT OPTION YOU SELECT ABOVE, YOU MUST PUT YOUR FINAL ANSWERS IN THE BOX BELOW. FAILURE TO DO SO WILL RESULT IN A ZERO FOR THIS
PROBLEM!***
Suppose we have
scatter diagram for the heights of 3,000 pairs of fathers and sons. The summary statistics are:
average height of fathers 70 inches
SD-8 inches
average height of sons 72 inches
SD-4 inches,
r 0.7
Find linear regression line for predicting height of the father(y variable) from the height of their sons(x variable). Use it to predict the height of a father whose son's height is 65 inches.
For the toolbar, press ALT+F10 (PC) or ALT+FN+F10 (Mac).
BIUS Paragraph
Arial
10pt
AV AV I
XQ 52
E
X² X₂G >11<
± RBC
ST ΨΩΘ.
安安图 † (:)
>
BAD
Expert Solution
This question has been solved!
Explore an expertly crafted, step-by-step solution for a thorough understanding of key concepts.

Step by step
Solved in 2 steps

Recommended textbooks for you
Linear Algebra: A Modern Introduction
Algebra
ISBN:
9781285463247
Author:
David Poole
Publisher:
Cengage Learning

Elementary Geometry For College Students, 7e
Geometry
ISBN:
9781337614085
Author:
Alexander, Daniel C.; Koeberlein, Geralyn M.
Publisher:
Cengage,

Algebra: Structure And Method, Book 1
Algebra
ISBN:
9780395977224
Author:
Richard G. Brown, Mary P. Dolciani, Robert H. Sorgenfrey, William L. Cole
Publisher:
McDougal Littell
Linear Algebra: A Modern Introduction
Algebra
ISBN:
9781285463247
Author:
David Poole
Publisher:
Cengage Learning
Elementary Geometry For College Students, 7e
Geometry
ISBN:
9781337614085
Author:
Alexander, Daniel C.; Koeberlein, Geralyn M.
Publisher:
Cengage,
Algebra: Structure And Method, Book 1
Algebra
ISBN:
9780395977224
Author:
Richard G. Brown, Mary P. Dolciani, Robert H. Sorgenfrey, William L. Cole
Publisher:
McDougal Littell