Step 1 of 8: What is the Center Line of the control chart? Round your answer to three decimal places.
Step 1 of 8: What is the Center Line of the control chart? Round your answer to three decimal places.

Glencoe Algebra 1, Student Edition, 9780079039897, 0079039898, 2018
18th Edition
ISBN:9780079039897
Author:Carter
Publisher:Carter
Chapter10: Statistics
Section10.3: Measures Of Spread
Problem 1GP

Related questions
Question
Please do not give solution in image format thanku
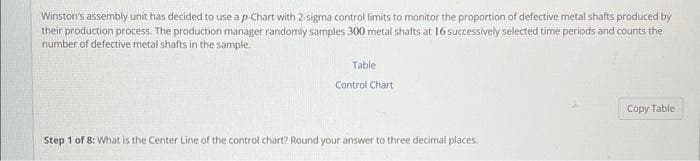
Transcribed Image Text:Winston's assembly unit has decided to use a p-Chart with 2-sigma control limits to monitor the proportion of defective metal shafts produced by
their production process. The production manager randomly samples 300 metal shafts at 16 successively selected time periods and counts the
number of defective metal shafts in the sample.
Table
Control Chart
Step 1 of 8: What is the Center Line of the control chart? Round your answer to three decimal places.
Copy Table:
Expert Solution
This question has been solved!
Explore an expertly crafted, step-by-step solution for a thorough understanding of key concepts.

Step by step
Solved in 3 steps with 1 images

Recommended textbooks for you
Glencoe Algebra 1, Student Edition, 9780079039897…
Algebra
ISBN:
9780079039897
Author:
Carter
Publisher:
McGraw Hill

College Algebra (MindTap Course List)
Algebra
ISBN:
9781305652231
Author:
R. David Gustafson, Jeff Hughes
Publisher:
Cengage Learning
Glencoe Algebra 1, Student Edition, 9780079039897…
Algebra
ISBN:
9780079039897
Author:
Carter
Publisher:
McGraw Hill
College Algebra (MindTap Course List)
Algebra
ISBN:
9781305652231
Author:
R. David Gustafson, Jeff Hughes
Publisher:
Cengage Learning