Step 1. Test Set-up Tony V. owns a house painting business in Seattle. He estimates that it takes his crew three-and-a-half days to paint the interior of a typical house. He has no estimate of the population standard deviation, o. He is testing a new paint that is supposed to dry faster than the paint he has been using for over thirty years. He estimates that the average time to paint a house is 3.5 days, the new paint is just as good as the old paint and costs the same. Research Question: Does the new paint allow him to complete a house painting job faster than the paint he has been using? He takes a random sample of 30 homes and paints them with the new paint. Here are the results: Number of Days to Paint House 3.40 3.75 3.33 3.50 3.33 3.50 3.00 3.40 3.50 3.40 3.00 2.85 3.85 3.33 3.33 3.50 3.33 3.33 2.75 3.50 2.75 3.40 3.33 3.50 3.50 0.33 3.40 3.25 3.00 3.50 The population mean, µ. is presumed to be 3.5 days and the population standard deviation, o, is unknown. Using Microsoft Excel, find the sample mean, X, and sample standard deviation, s, and complete the appropriate significance test. What O statistic should you use and why? (There are three basic one-sample hypothesis tests: 1) z-test for the population mean, 2) z-test for the population proportion, and 3) t-test for the population mean.) Based on the research question is this a left-tailed, two-tailed, or right-tailed test? Step 2. Select the Level of Significance, a A 5 percent significance level has been selected. What is the Critical Value or Values of the Test Statistic? Step 3. State the null hypothesis (Ho) and alternate hypothesis (H;) Ho: H:: Follow the examples shown in Clear-Sighted Statistics. You must use the appropriate Greek letters and mathematical symbols. = +s> 2 < n² | x² Step 4. Compose the decision rule using critical values not p-values. Follow the examples shown in Clear-Sighted Statistics. Step 5. Calculate the Value of the Test Statistic, p-value, Effect Size, Statistical Power and the Probability of a Type II Error
Step 1. Test Set-up Tony V. owns a house painting business in Seattle. He estimates that it takes his crew three-and-a-half days to paint the interior of a typical house. He has no estimate of the population standard deviation, o. He is testing a new paint that is supposed to dry faster than the paint he has been using for over thirty years. He estimates that the average time to paint a house is 3.5 days, the new paint is just as good as the old paint and costs the same. Research Question: Does the new paint allow him to complete a house painting job faster than the paint he has been using? He takes a random sample of 30 homes and paints them with the new paint. Here are the results: Number of Days to Paint House 3.40 3.75 3.33 3.50 3.33 3.50 3.00 3.40 3.50 3.40 3.00 2.85 3.85 3.33 3.33 3.50 3.33 3.33 2.75 3.50 2.75 3.40 3.33 3.50 3.50 0.33 3.40 3.25 3.00 3.50 The population mean, µ. is presumed to be 3.5 days and the population standard deviation, o, is unknown. Using Microsoft Excel, find the sample mean, X, and sample standard deviation, s, and complete the appropriate significance test. What O statistic should you use and why? (There are three basic one-sample hypothesis tests: 1) z-test for the population mean, 2) z-test for the population proportion, and 3) t-test for the population mean.) Based on the research question is this a left-tailed, two-tailed, or right-tailed test? Step 2. Select the Level of Significance, a A 5 percent significance level has been selected. What is the Critical Value or Values of the Test Statistic? Step 3. State the null hypothesis (Ho) and alternate hypothesis (H;) Ho: H:: Follow the examples shown in Clear-Sighted Statistics. You must use the appropriate Greek letters and mathematical symbols. = +s> 2 < n² | x² Step 4. Compose the decision rule using critical values not p-values. Follow the examples shown in Clear-Sighted Statistics. Step 5. Calculate the Value of the Test Statistic, p-value, Effect Size, Statistical Power and the Probability of a Type II Error

MATLAB: An Introduction with Applications
6th Edition
ISBN:9781119256830
Author:Amos Gilat
Publisher:Amos Gilat
Chapter1: Starting With Matlab
Section: Chapter Questions
Problem 1P

Related questions
Question
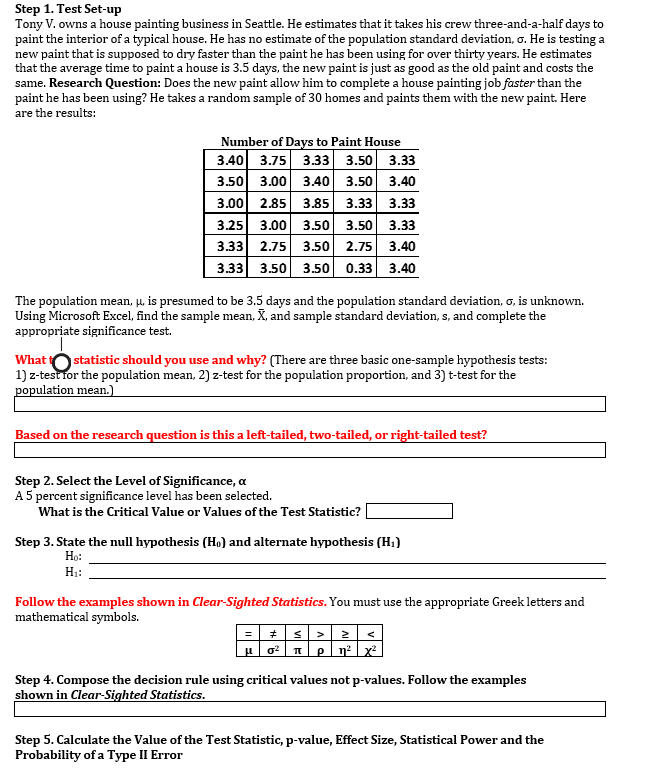
Transcribed Image Text:Step 1. Test Set-up
Tony V. owns a house painting business in Seattle. He estimates that it takes his crew three-and-a-half days to
paint the interior of a typical house. He has no estimate of the population standard deviation, o. He is testing a
new paint that is supposed to dry faster than the paint he has been using for over thirty years. He estimates
that the average time to paint a house is 3.5 days, the new paint is just as good as the old paint and costs the
same. Research Question: Does the new paint allow him to complete a house painting job faster than the
paint he has been using? He takes a random sample of 30 homes and paints them with the new paint. Here
are the results:
Number of Days to Paint House
3.40 3.75 3.33 3.50 3.33
3.50 3.00 3.40 3.50 3.40
3.00
2.85
3.85
3.33
3.33
3.25 3.00 3.50
3.33 2.75 3.50 2.75 3.40
3.33 3.50 3.50 0.33 3.40
3.50
3.33
The population mean, µ, is presumed to be 3.5 days and the population standard deviation, o, is unknown.
Using Microsoft Excel, find the sample mean, X, and sample standard deviation, s, and complete the
appropriate significance test.
What O statistic should you use and why? (There are three basic one-sample hypothesis tests:
1) z-test ror the population mean, 2) z-test for the population proportion, and 3) t-test for the
population mean.)
Based on the research question is this a left-tailed, two-tailed, or right-tailed test?
Step 2. Select the Level of Significance,
e, a
A 5 percent significance level has been selected.
What is the Critical Value or Values of the Test Statistic?
Step 3. State the null hypothesis (Ho) and alternate hypothesis (H;)
Ho:
H:
Follow the examples shown in Clear-Sighted Statistics. You must use the appropriate Greek letters and
mathematical symbols.
<
n2 x
Step 4. Compose the decision rule using critical values not p-values. Follow the examples
shown in Clear-Sighted Statistics.
Step 5. Calculate the Value of the Test Statistic, p-value, Effect Size, Statistical Power and the
Probability of a Type II Error
Expert Solution
This question has been solved!
Explore an expertly crafted, step-by-step solution for a thorough understanding of key concepts.

This is a popular solution!

Trending now
This is a popular solution!

Step by step
Solved in 2 steps with 1 images

Recommended textbooks for you
MATLAB: An Introduction with Applications
Statistics
ISBN:
9781119256830
Author:
Amos Gilat
Publisher:
John Wiley & Sons Inc

Probability and Statistics for Engineering and th…
Statistics
ISBN:
9781305251809
Author:
Jay L. Devore
Publisher:
Cengage Learning

Statistics for The Behavioral Sciences (MindTap C…
Statistics
ISBN:
9781305504912
Author:
Frederick J Gravetter, Larry B. Wallnau
Publisher:
Cengage Learning
MATLAB: An Introduction with Applications
Statistics
ISBN:
9781119256830
Author:
Amos Gilat
Publisher:
John Wiley & Sons Inc
Probability and Statistics for Engineering and th…
Statistics
ISBN:
9781305251809
Author:
Jay L. Devore
Publisher:
Cengage Learning
Statistics for The Behavioral Sciences (MindTap C…
Statistics
ISBN:
9781305504912
Author:
Frederick J Gravetter, Larry B. Wallnau
Publisher:
Cengage Learning

Elementary Statistics: Picturing the World (7th E…
Statistics
ISBN:
9780134683416
Author:
Ron Larson, Betsy Farber
Publisher:
PEARSON

The Basic Practice of Statistics
Statistics
ISBN:
9781319042578
Author:
David S. Moore, William I. Notz, Michael A. Fligner
Publisher:
W. H. Freeman

Introduction to the Practice of Statistics
Statistics
ISBN:
9781319013387
Author:
David S. Moore, George P. McCabe, Bruce A. Craig
Publisher:
W. H. Freeman