Step 2: Options (Select) (SELECT) 1. ≤, ≥, = (SELECT) 2. not valid, valid (SELECT) 3. left skewed, right skewed, approximately normal
Step 2: Options (Select) (SELECT) 1. ≤, ≥, = (SELECT) 2. not valid, valid (SELECT) 3. left skewed, right skewed, approximately normal

MATLAB: An Introduction with Applications
6th Edition
ISBN:9781119256830
Author:Amos Gilat
Publisher:Amos Gilat
Chapter1: Starting With Matlab
Section: Chapter Questions
Problem 1P

Related questions
Question
Step 2:
Options (Select)
(SELECT) 1. ≤, ≥, =
(SELECT) 2. not valid, valid
(SELECT) 3. left skewed, right skewed, approximately normal
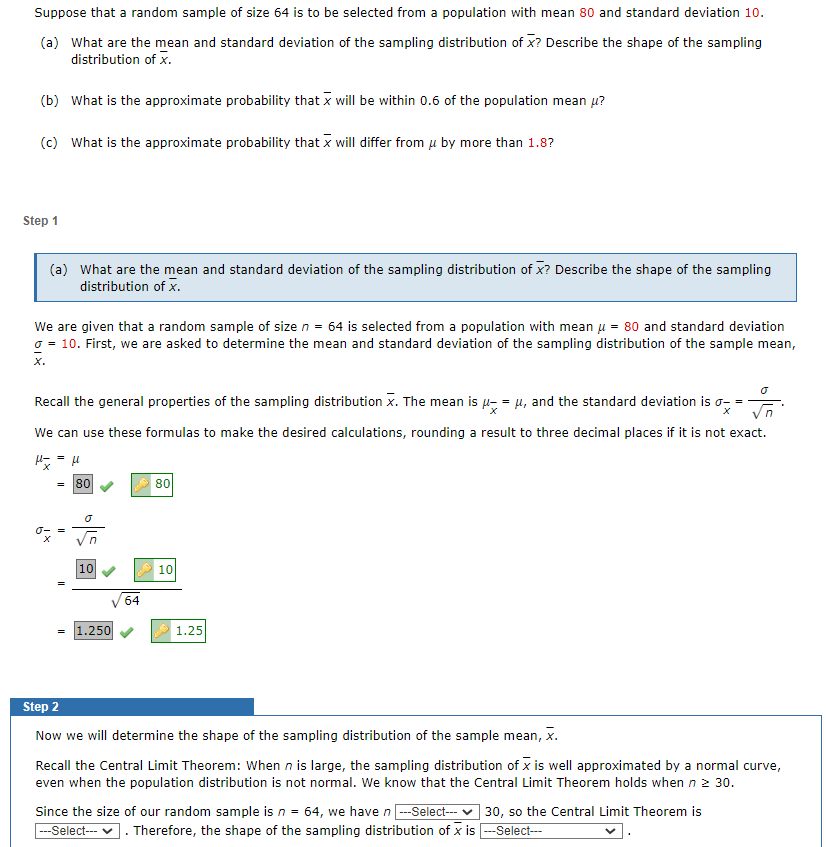
Transcribed Image Text:Suppose that a random sample of size 64 is to be selected from a population with mean 80 and standard deviation 10.
(a) What are the mean and standard deviation of the sampling distribution of X? Describe the shape of the sampling
distribution of x.
(b) What is the approximate probability that will be within 0.6 of the population mean u?
(c) What is the approximate probability that will differ from u by more than 1.8?
Step 1
(a) What are the mean and standard deviation of the sampling distribution of x? Describe the shape of the sampling
distribution of x.
We are given that a random sample of size n = 64 is selected from a population with mean μ = 80 and standard deviation
o = 10. First, we are asked to determine the mean and standard deviation of the sampling distribution of the sample mean,
X.
Ō
Recall the general properties of the sampling distribution x. The mean is μ = μ, and the standard deviation is σ==
vo
X
We can use these formulas to make the desired calculations, rounding a result to three decimal places if it is not exact.
μ= = μ
80
σ- =
=
0
10
1.250
64
80
10
1.25
Step 2
Now we will determine the shape of the sampling distribution of the sample mean, x.
Recall the Central Limit Theorem: When n is large, the sampling distribution of x is well approximated by a normal curve,
even when the population distribution is not normal. We know that the Central Limit Theorem holds when n 2 30.
Since the size of our random sample is n = 64, we have n ---Select---30, so the Central Limit Theorem is
---Select--- ✓. Therefore, the shape of the sampling distribution of X is ---Select---
Expert Solution
This question has been solved!
Explore an expertly crafted, step-by-step solution for a thorough understanding of key concepts.

Step by step
Solved in 2 steps

Recommended textbooks for you
MATLAB: An Introduction with Applications
Statistics
ISBN:
9781119256830
Author:
Amos Gilat
Publisher:
John Wiley & Sons Inc

Probability and Statistics for Engineering and th…
Statistics
ISBN:
9781305251809
Author:
Jay L. Devore
Publisher:
Cengage Learning

Statistics for The Behavioral Sciences (MindTap C…
Statistics
ISBN:
9781305504912
Author:
Frederick J Gravetter, Larry B. Wallnau
Publisher:
Cengage Learning
MATLAB: An Introduction with Applications
Statistics
ISBN:
9781119256830
Author:
Amos Gilat
Publisher:
John Wiley & Sons Inc
Probability and Statistics for Engineering and th…
Statistics
ISBN:
9781305251809
Author:
Jay L. Devore
Publisher:
Cengage Learning
Statistics for The Behavioral Sciences (MindTap C…
Statistics
ISBN:
9781305504912
Author:
Frederick J Gravetter, Larry B. Wallnau
Publisher:
Cengage Learning

Elementary Statistics: Picturing the World (7th E…
Statistics
ISBN:
9780134683416
Author:
Ron Larson, Betsy Farber
Publisher:
PEARSON

The Basic Practice of Statistics
Statistics
ISBN:
9781319042578
Author:
David S. Moore, William I. Notz, Michael A. Fligner
Publisher:
W. H. Freeman

Introduction to the Practice of Statistics
Statistics
ISBN:
9781319013387
Author:
David S. Moore, George P. McCabe, Bruce A. Craig
Publisher:
W. H. Freeman