Steve believes that his wife's cell phone battery does not last as long as his cell phone battery. On seven different occasions, he measured the length of time his cell phone battery lasted and calculated that the mean was 16.3 hours with a standard deviation of 5.5 hours. He measured the length of time his wife's cell phone battery lasted on eleven different occasions and calculated a mean of 21.6 hours with a standard deviation of 2.7 hours. Assume that the population variances are the same. Let Population 1 be the battery life of Steve's cell phone and Population 2 be the battery life of his wife's cell phone. Step 2 of 2: Interpret the confidence interval obtained in Step 1. Answer Tables Keypad Keyboard Shortcuts O w are 90% confident that the mean battery ife of Steve's cell phone is between 1.9 hours and 8.7 hours longer than the mean battery life of his wife's cell phone. O We are 90% confident that the mean battery ife of Steves cell phone is between 1.9 hours and 8.7 hours shorter than the mean battery life of his wife's cell phone. O ice the confidence interval does not contain zero. the data do not provide evidence that the population means are unequal at a 90 % confidence level. O Iince the confidence interval contains zero, the data do not provide evidence that the population means are unequal at a 90% confidence level.
Steve believes that his wife's cell phone battery does not last as long as his cell phone battery. On seven different occasions, he measured the length of time his cell phone battery lasted and calculated that the mean was 16.3 hours with a standard deviation of 5.5 hours. He measured the length of time his wife's cell phone battery lasted on eleven different occasions and calculated a mean of 21.6 hours with a standard deviation of 2.7 hours. Assume that the population variances are the same. Let Population 1 be the battery life of Steve's cell phone and Population 2 be the battery life of his wife's cell phone. Step 2 of 2: Interpret the confidence interval obtained in Step 1. Answer Tables Keypad Keyboard Shortcuts O w are 90% confident that the mean battery ife of Steve's cell phone is between 1.9 hours and 8.7 hours longer than the mean battery life of his wife's cell phone. O We are 90% confident that the mean battery ife of Steves cell phone is between 1.9 hours and 8.7 hours shorter than the mean battery life of his wife's cell phone. O ice the confidence interval does not contain zero. the data do not provide evidence that the population means are unequal at a 90 % confidence level. O Iince the confidence interval contains zero, the data do not provide evidence that the population means are unequal at a 90% confidence level.

Glencoe Algebra 1, Student Edition, 9780079039897, 0079039898, 2018
18th Edition
ISBN:9780079039897
Author:Carter
Publisher:Carter
Chapter10: Statistics
Section10.6: Summarizing Categorical Data
Problem 10CYU

Related questions
Question
Transcribed Image Text:C
. Lesson 9.2 Certify Mode. Questio .x.
X How to calculate Z-Score in Exce x , confidence interval.calculator-X
f Facebook
A learn.hawkeslearning.com/Portal/Lesson/lesson_certify#!
+ Save & Exit Certify
Lesson: 9.2 Comparing Two Population Me.
LORETTA STONE
1/14
Question 2 of 8, Step 2 of 2
Correct
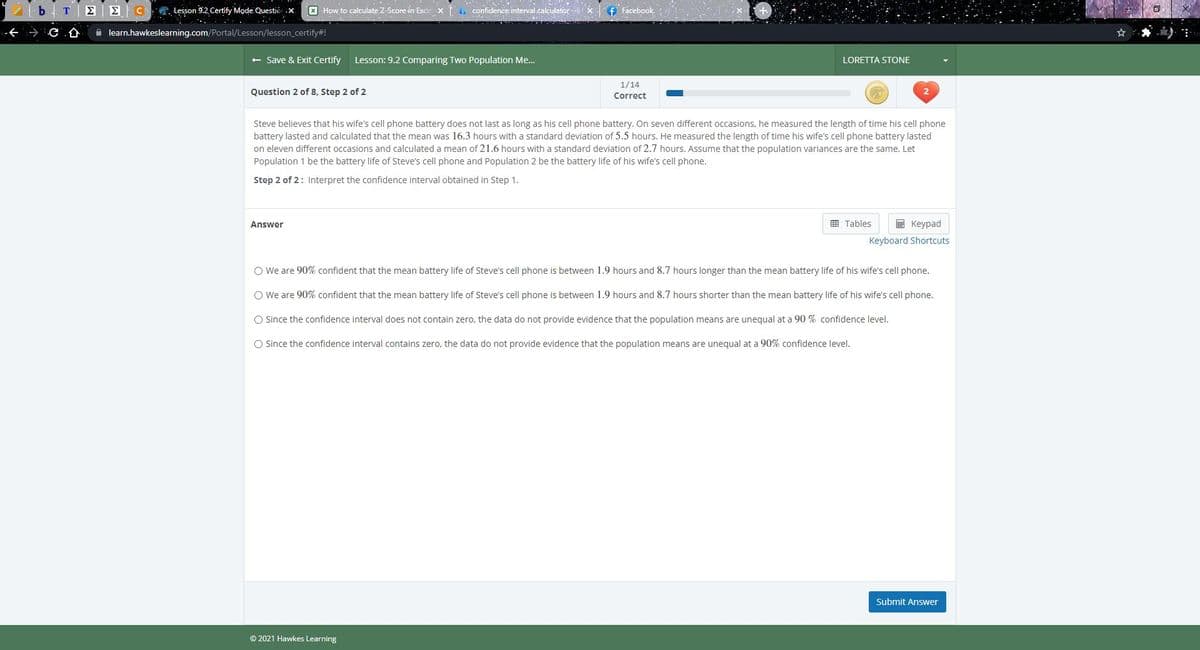
Steve believes that his wife's cell phone battery does not last as long as his cell phone battery. On seven different occasions, he measured the length of time his cell phone
battery lasted and calculated that the mean was 16.3 hours with a standard deviation of 5.5 hours. He measured the length of time his wife's cell phone battery lasted
on eleven different occasions and calculated a mean of 21.6 hours with a standard deviation of 2.7 hours. Assume that the population variances are the same. Let
Population 1 be the battery life of Steve's cell phone and Population 2 be the battery life of his wife's cell phone.
Step 2 of 2: Interpret the confidence interval obtained in Step 1.
E Tables
E Keypad
Answer
Keyboard Shortcuts
O We are 90% confident that the mean battery life of Steve's cell phone is between 1.9 hours and 8.7 hours longer than the mean battery life of his wife's cell phone.
O We are 90% confident that the mean battery life of Steve's cell phone is between 1.9 hours and 8.7 hours shorter than the mean battery life of his wife's cell phone.
O Since the confidence interval does not contain zero, the data do not provide evidence that the population means are unequal at a 90 % confidence level.
O Since the confidence interval contains zero, the data do not provide evidence that the population means are unequal at a 90% confidence level.
Submit Answer
© 2021 Hawkes Learning
Expert Solution
This question has been solved!
Explore an expertly crafted, step-by-step solution for a thorough understanding of key concepts.

This is a popular solution!

Trending now
This is a popular solution!

Step by step
Solved in 3 steps with 3 images

Recommended textbooks for you
Glencoe Algebra 1, Student Edition, 9780079039897…
Algebra
ISBN:
9780079039897
Author:
Carter
Publisher:
McGraw Hill

Holt Mcdougal Larson Pre-algebra: Student Edition…
Algebra
ISBN:
9780547587776
Author:
HOLT MCDOUGAL
Publisher:
HOLT MCDOUGAL

College Algebra (MindTap Course List)
Algebra
ISBN:
9781305652231
Author:
R. David Gustafson, Jeff Hughes
Publisher:
Cengage Learning
Glencoe Algebra 1, Student Edition, 9780079039897…
Algebra
ISBN:
9780079039897
Author:
Carter
Publisher:
McGraw Hill
Holt Mcdougal Larson Pre-algebra: Student Edition…
Algebra
ISBN:
9780547587776
Author:
HOLT MCDOUGAL
Publisher:
HOLT MCDOUGAL
College Algebra (MindTap Course List)
Algebra
ISBN:
9781305652231
Author:
R. David Gustafson, Jeff Hughes
Publisher:
Cengage Learning