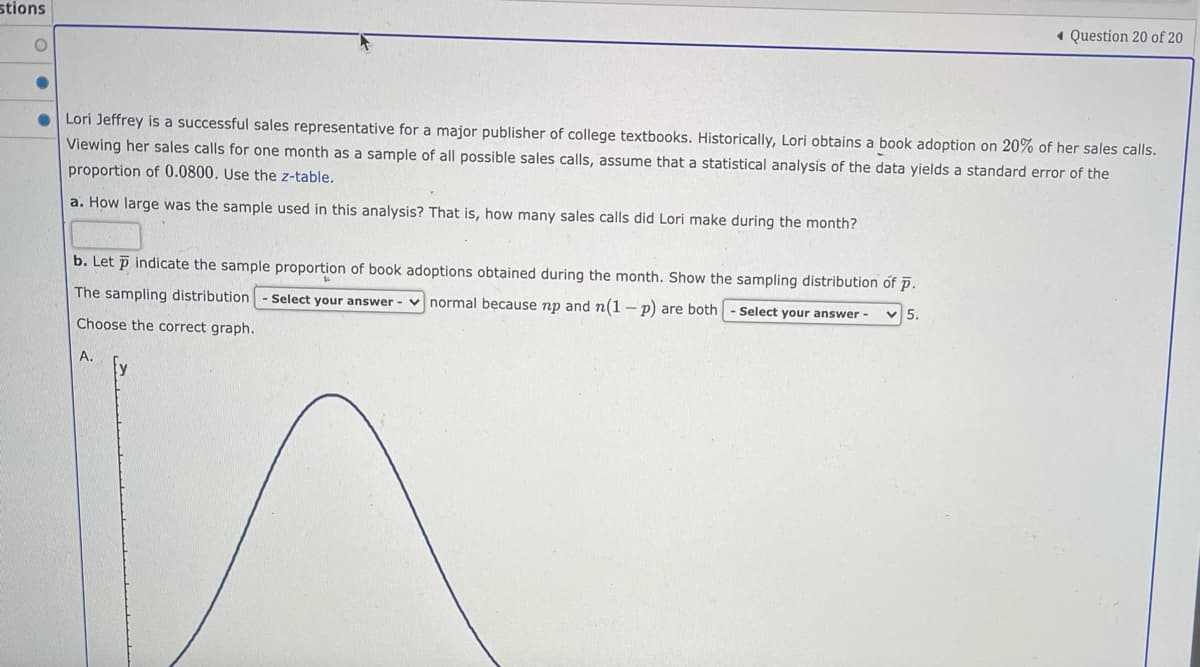
stions « Question 20 of 20 O Lori Jeffrey is a successful sales representative for a major publisher of college textbooks. Historically, Lori obtains a book adoption on 20% of her sales calls. Viewing her sales calls for one month as a sample of all possible sales calls, assume that a statistical analysis of the data yields a standard eror of the proportion of 0.0800. Use the z-table. a. How large was the sample used in this analysis? That is, how many sales calls did Lori make during the month? b. Let p indicate the sample proportion of book adoptions obtained during the month. Show the sampling distribution of p. The sampling distribution Select your answer - v normal because np and n(1 – p) are both Select your answer - 5. Choose the correct graph. A.
stions « Question 20 of 20 O Lori Jeffrey is a successful sales representative for a major publisher of college textbooks. Historically, Lori obtains a book adoption on 20% of her sales calls. Viewing her sales calls for one month as a sample of all possible sales calls, assume that a statistical analysis of the data yields a standard eror of the proportion of 0.0800. Use the z-table. a. How large was the sample used in this analysis? That is, how many sales calls did Lori make during the month? b. Let p indicate the sample proportion of book adoptions obtained during the month. Show the sampling distribution of p. The sampling distribution Select your answer - v normal because np and n(1 – p) are both Select your answer - 5. Choose the correct graph. A.

Functions and Change: A Modeling Approach to College Algebra (MindTap Course List)
6th Edition
ISBN:9781337111348
Author:Bruce Crauder, Benny Evans, Alan Noell
Publisher:Bruce Crauder, Benny Evans, Alan Noell
Chapter5: A Survey Of Other Common Functions
Section5.3: Modeling Data With Power Functions
Problem 6E: Urban Travel Times Population of cities and driving times are related, as shown in the accompanying...

Related questions
Question
Transcribed Image Text:stions
1 Question 20 of 20
O Lori Jeffrey is a successful sales representative for a major publisher of college textbooks. Historically, Lori obtains a book adoption on 20% of her sales calls.
Viewing her sales calls for one month as a sample of all possible sales calls, assume that a statistical analysis of the data yields a standard eror of the
proportion of 0.0800. Use the z-table.
a. How large was the sample used in this analysis? That is, how many sales calls did Lori make during the month?
b. Let p indicate the sample proportion of book adoptions obtained during the month. Show the sampling distribution of p.
The sampling distribution
Select your answer - v normal because np and n(1 – p) are both
Select your answer -
5.
Choose the correct graph.
A.
Expert Solution
This question has been solved!
Explore an expertly crafted, step-by-step solution for a thorough understanding of key concepts.

This is a popular solution!

Trending now
This is a popular solution!

Step by step
Solved in 2 steps with 2 images

Recommended textbooks for you
Functions and Change: A Modeling Approach to Coll…
Algebra
ISBN:
9781337111348
Author:
Bruce Crauder, Benny Evans, Alan Noell
Publisher:
Cengage Learning

Glencoe Algebra 1, Student Edition, 9780079039897…
Algebra
ISBN:
9780079039897
Author:
Carter
Publisher:
McGraw Hill
Functions and Change: A Modeling Approach to Coll…
Algebra
ISBN:
9781337111348
Author:
Bruce Crauder, Benny Evans, Alan Noell
Publisher:
Cengage Learning
Glencoe Algebra 1, Student Edition, 9780079039897…
Algebra
ISBN:
9780079039897
Author:
Carter
Publisher:
McGraw Hill