Stocks A and B have the following historical returns: Year PA 2009 -17.30% -15.10% 2010 36.75 24.70 2011 18.50 38.60 2012 -2.25 -7.20 2013 31.75 28.45 Calculate the average rate of return for each stock during the past 5-year period of time.
Stocks A and B have the following historical returns: Year PA 2009 -17.30% -15.10% 2010 36.75 24.70 2011 18.50 38.60 2012 -2.25 -7.20 2013 31.75 28.45 Calculate the average rate of return for each stock during the past 5-year period of time.

Intermediate Financial Management (MindTap Course List)
13th Edition
ISBN:9781337395083
Author:Eugene F. Brigham, Phillip R. Daves
Publisher:Eugene F. Brigham, Phillip R. Daves
Chapter8: Basic Stock Valuation
Section: Chapter Questions
Problem 8P: A stock is trading at $80 per share. The stock is expected to have a yearend dividend of $4 per...

Related questions
Question
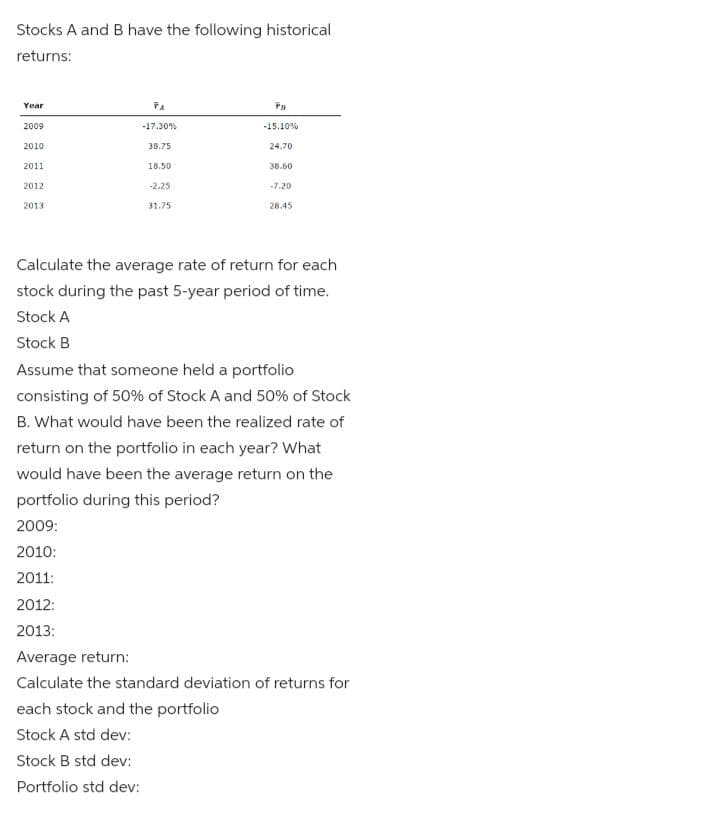
Transcribed Image Text:Stocks A and B have the following historical
returns:
Year
TA
2009
-17.30%
-15.10%
2010
38.75
24.70
2011
18.50
38,60
2012
-2.25
-7.20
2013
31.75
28.45
Calculate the average rate of return for each
stock during the past 5-year period of time.
Stock A
Stock B
Assume that someone held a portfolio
consisting of 50% of Stock A and 50% of Stock
B. What would have been the realized rate of
return on the portfolio in each year? What
would have been the average return on the
portfolio during this period?
2009:
2010:
2011:
2012:
2013:
Average return:
Calculate the standard deviation of returns for
each stock and the portfolio
Stock A std dev:
Stock B std dev:
Portfolio std dev:
Expert Solution
This question has been solved!
Explore an expertly crafted, step-by-step solution for a thorough understanding of key concepts.

Step by step
Solved in 2 steps

Knowledge Booster


Learn more about
Need a deep-dive on the concept behind this application? Look no further. Learn more about this topic, finance and related others by exploring similar questions and additional content below.Recommended textbooks for you
Intermediate Financial Management (MindTap Course…
Finance
ISBN:
9781337395083
Author:
Eugene F. Brigham, Phillip R. Daves
Publisher:
Cengage Learning

EBK CONTEMPORARY FINANCIAL MANAGEMENT
Finance
ISBN:
9781337514835
Author:
MOYER
Publisher:
CENGAGE LEARNING - CONSIGNMENT

Pfin (with Mindtap, 1 Term Printed Access Card) (…
Finance
ISBN:
9780357033609
Author:
Randall Billingsley, Lawrence J. Gitman, Michael D. Joehnk
Publisher:
Cengage Learning
Intermediate Financial Management (MindTap Course…
Finance
ISBN:
9781337395083
Author:
Eugene F. Brigham, Phillip R. Daves
Publisher:
Cengage Learning
EBK CONTEMPORARY FINANCIAL MANAGEMENT
Finance
ISBN:
9781337514835
Author:
MOYER
Publisher:
CENGAGE LEARNING - CONSIGNMENT
Pfin (with Mindtap, 1 Term Printed Access Card) (…
Finance
ISBN:
9780357033609
Author:
Randall Billingsley, Lawrence J. Gitman, Michael D. Joehnk
Publisher:
Cengage Learning


Survey of Accounting (Accounting I)
Accounting
ISBN:
9781305961883
Author:
Carl Warren
Publisher:
Cengage Learning

Managerial Accounting
Accounting
ISBN:
9781337912020
Author:
Carl Warren, Ph.d. Cma William B. Tayler
Publisher:
South-Western College Pub