The table below provides the realized annual returns for a stock index during six consecutive years. 2014 2015 2016 2017 2018 2019 39.6% 35.5% 17.2% 32.2% 25.5% 3.0% Calculate the historical volatility of the stock during this six-year period. 15.18% 16.00% 13.56% 14.37% 16.81%
The table below provides the realized annual returns for a stock index during six consecutive years. 2014 2015 2016 2017 2018 2019 39.6% 35.5% 17.2% 32.2% 25.5% 3.0% Calculate the historical volatility of the stock during this six-year period. 15.18% 16.00% 13.56% 14.37% 16.81%

Survey of Accounting (Accounting I)
8th Edition
ISBN:9781305961883
Author:Carl Warren
Publisher:Carl Warren
Chapter15: Capital Investment Analysis
Section: Chapter Questions
Problem 15.1.2MBA

Related questions
Question
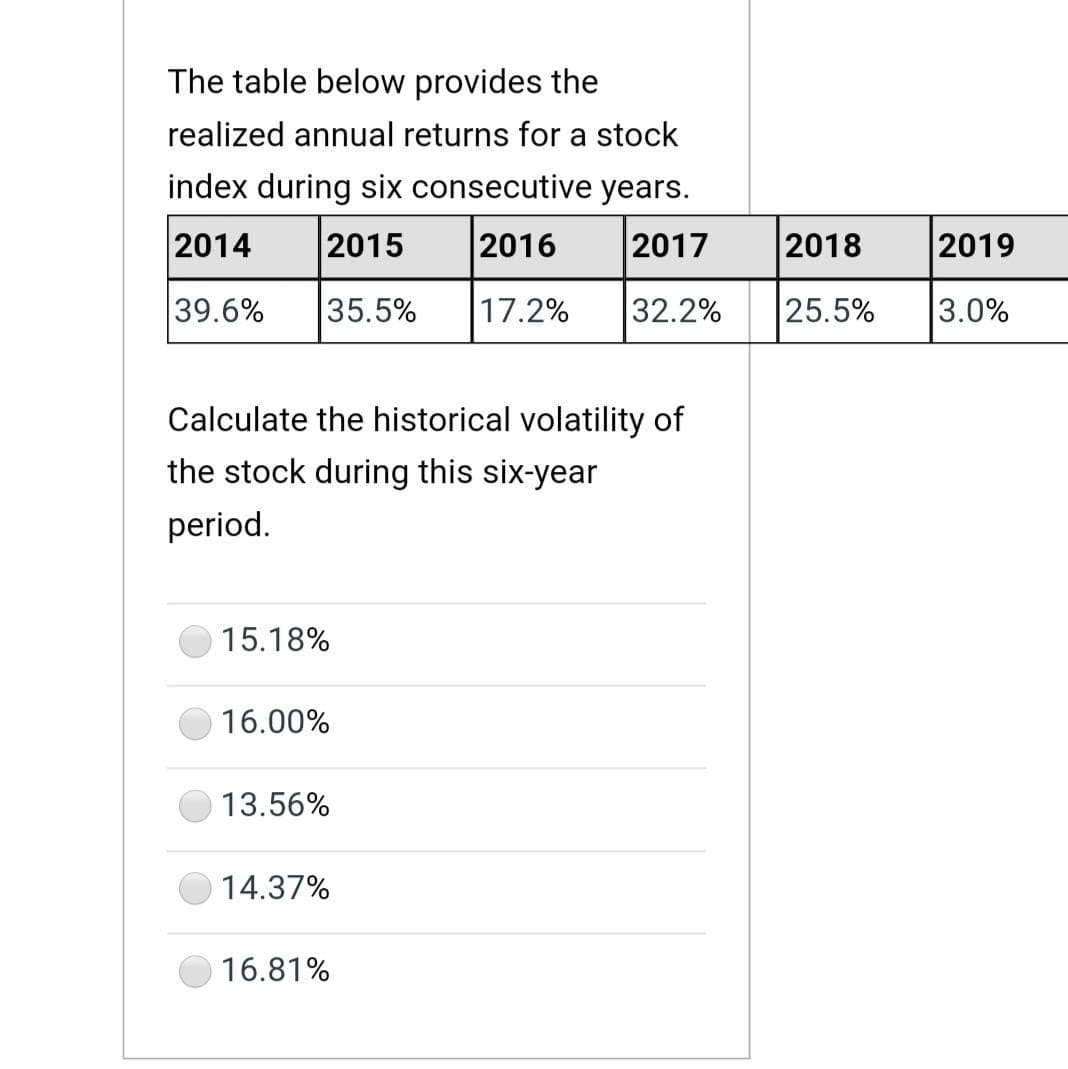
Transcribed Image Text:The table below provides the
realized annual returns for a stock
index during six consecutive years.
2014
|2015
2016
2017
2018
2019
39.6%
35.5%
17.2%
32.2%
25.5%
3.0%
Calculate the historical volatility of
the stock during this six-year
period.
15.18%
16.00%
13.56%
14.37%
16.81%
Expert Solution
This question has been solved!
Explore an expertly crafted, step-by-step solution for a thorough understanding of key concepts.

Step by step
Solved in 2 steps with 2 images

Knowledge Booster


Learn more about
Need a deep-dive on the concept behind this application? Look no further. Learn more about this topic, finance and related others by exploring similar questions and additional content below.Recommended textbooks for you
Survey of Accounting (Accounting I)
Accounting
ISBN:
9781305961883
Author:
Carl Warren
Publisher:
Cengage Learning


Managerial Accounting
Accounting
ISBN:
9781337912020
Author:
Carl Warren, Ph.d. Cma William B. Tayler
Publisher:
South-Western College Pub
Survey of Accounting (Accounting I)
Accounting
ISBN:
9781305961883
Author:
Carl Warren
Publisher:
Cengage Learning
Managerial Accounting
Accounting
ISBN:
9781337912020
Author:
Carl Warren, Ph.d. Cma William B. Tayler
Publisher:
South-Western College Pub

EBK CONTEMPORARY FINANCIAL MANAGEMENT
Finance
ISBN:
9781337514835
Author:
MOYER
Publisher:
CENGAGE LEARNING - CONSIGNMENT

Pfin (with Mindtap, 1 Term Printed Access Card) (…
Finance
ISBN:
9780357033609
Author:
Randall Billingsley, Lawrence J. Gitman, Michael D. Joehnk
Publisher:
Cengage Learning

Fundamentals of Financial Management, Concise Edi…
Finance
ISBN:
9781285065137
Author:
Eugene F. Brigham, Joel F. Houston
Publisher:
Cengage Learning