An article in Wood Science and Technology, "Creep in Chipboard, Part 3: Initial Assessment of the Influence of Moisture Content and Level of Stressing on Rate of Creep and Time to Failure" (1981, Vol. 15, pp. 125-144) studied the deflection (mm) of particleboard from stress levels of relative humidity. Assume that the two variables are related according to the simple linear regression model. The data are shown below 54 54 61 61 x = Stress level (%) y = Deflection (mm) 16.473 18.693 14.305 15.121 13.505 11.64 11.168 12.534 11.224 68 68 75 75
An article in Wood Science and Technology, "Creep in Chipboard, Part 3: Initial Assessment of the Influence of Moisture Content and Level of Stressing on Rate of Creep and Time to Failure" (1981, Vol. 15, pp. 125-144) studied the deflection (mm) of particleboard from stress levels of relative humidity. Assume that the two variables are related according to the simple linear regression model. The data are shown below 54 54 61 61 x = Stress level (%) y = Deflection (mm) 16.473 18.693 14.305 15.121 13.505 11.64 11.168 12.534 11.224 68 68 75 75

College Algebra
7th Edition
ISBN:9781305115545
Author:James Stewart, Lothar Redlin, Saleem Watson
Publisher:James Stewart, Lothar Redlin, Saleem Watson
Chapter1: Equations And Graphs
Section: Chapter Questions
Problem 10T: Olympic Pole Vault The graph in Figure 7 indicates that in recent years the winning Olympic men’s...

Related questions
Question
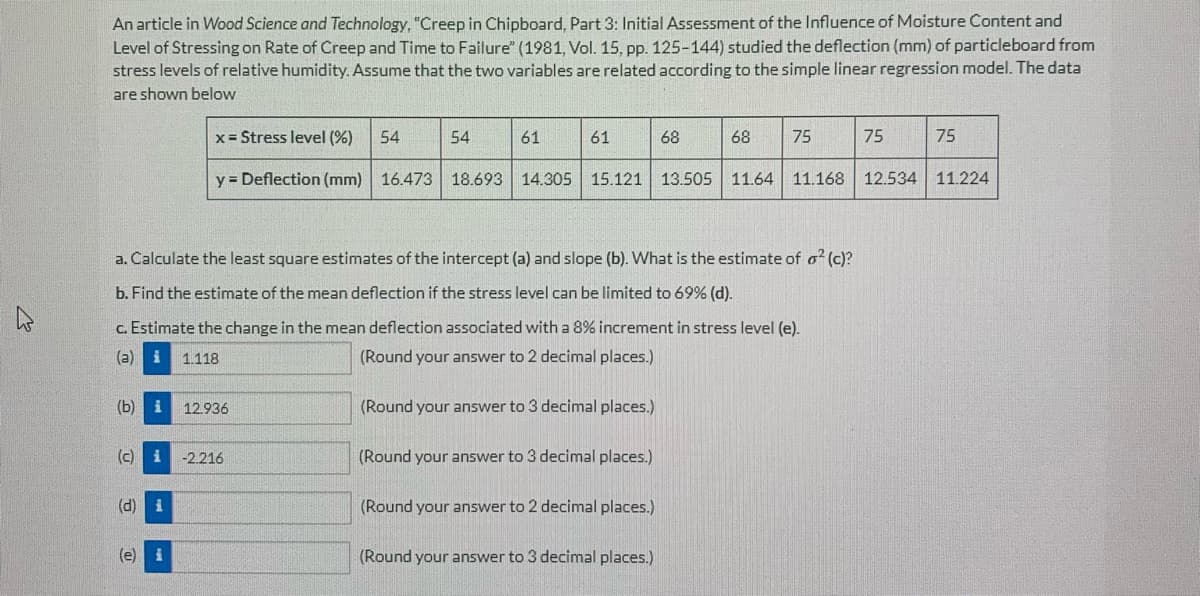
Transcribed Image Text:An article in Wood Science and Technology, "Creep in Chipboard, Part 3: Initial Assessment of the lInfluence of Moisture Content and
Level of Stressing on Rate of Creep and Time to Failure" (1981, Vol. 15. pp. 125-144) studied the deflection (mm) of particleboard from
stress levels of relative humidity. Assume that the two variables are related according to the simple linear regression model. The data
are shown below
x = Stress level (%)
54
54
61
61
68
68
75
75
75
y = Deflection (mm) 16.473 18.693 14.305
15.121 13.505 11.64 11.168 12.534 11.224
a. Calculate the least square estimates of the intercept (a) and slope (b). What is the estimate of o (c)?
b. Find the estimate of the mean deflection if the stress level can be limited to 69% (d).
c. Estimate the change in the mean deflection associated with a 8% increment in stress level (e).
(a)
1.118
(Round your answer to 2 decimal places.)
(b) i
12.936
(Round your answer to 3 decimal places.)
(c)
-2.216
(Round your answer to 3 decimal places.)
(d) i
(Round your answer to 2 decimal places.)
(e) i
(Round your answer to 3 decimal places.)
Expert Solution
This question has been solved!
Explore an expertly crafted, step-by-step solution for a thorough understanding of key concepts.

This is a popular solution!

Trending now
This is a popular solution!

Step by step
Solved in 2 steps

Recommended textbooks for you
College Algebra
Algebra
ISBN:
9781305115545
Author:
James Stewart, Lothar Redlin, Saleem Watson
Publisher:
Cengage Learning

Functions and Change: A Modeling Approach to Coll…
Algebra
ISBN:
9781337111348
Author:
Bruce Crauder, Benny Evans, Alan Noell
Publisher:
Cengage Learning
College Algebra
Algebra
ISBN:
9781305115545
Author:
James Stewart, Lothar Redlin, Saleem Watson
Publisher:
Cengage Learning
Functions and Change: A Modeling Approach to Coll…
Algebra
ISBN:
9781337111348
Author:
Bruce Crauder, Benny Evans, Alan Noell
Publisher:
Cengage Learning