Summarize the effects of a budget deficit by filling in the following table. Real Interest Rate Real Exchange Rate Trade Balance Effects of a Budget Deficit
Summarize the effects of a budget deficit by filling in the following table. Real Interest Rate Real Exchange Rate Trade Balance Effects of a Budget Deficit

Principles of Economics 2e
2nd Edition
ISBN:9781947172364
Author:Steven A. Greenlaw; David Shapiro
Publisher:Steven A. Greenlaw; David Shapiro
Chapter31: The Impacts Of Government Borrowing
Section: Chapter Questions
Problem 2SCQ: Assume an economy has a budget surplus of 1,000, private savings of 4,000, and investment of 5,000....

Related questions
Question
Summarize the effects of a budget deficit by filling in the following table.
Real Interest Rate
Real Exchange Rate
Trade Balance
Effects of a Budget Deficit
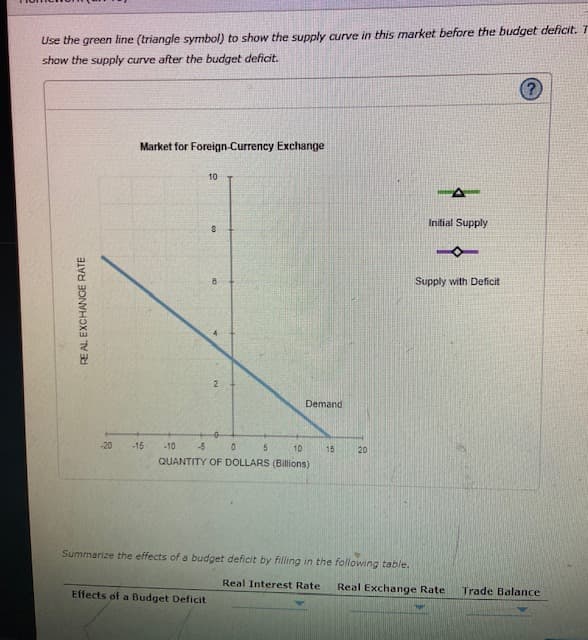
Transcribed Image Text:Use the green line (triangle symbol) to show the supply curve in this market before the budget deficit. T
show the supply curve after the budget deficit.
Market for Foreign-Currency Exchange
10
Initial Supply
8.
Supply with Deficit
2
Demand
-20
-15
-10
10
15
20
QUANTITY OF DOLLARS (Billions)
Summarize the effects of a budget deficit by filling in the following table.
Real Interest Rate
Effects of a Budget Deficit
Real Exchange Rate
Trade Balance
RE AL EXCHANGE RATE
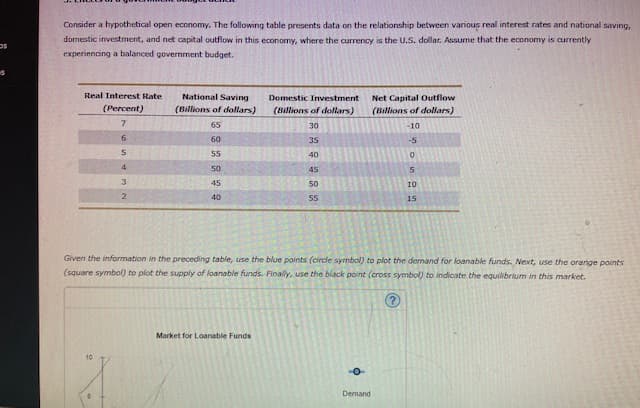
Transcribed Image Text:Consider a hypothetical open economy. The following table presents data on the relationship between various real interest rates and national saving,
domestic investment, and net capital outflow in this economy, where the currency is the U.S. dollar. Assume that the economy is aurrently
experiencing a balanced government budget.
Real Interest Rate
National Saving
Net Capital Outflow
(Billions of dollars)
Domestic Investment
(Percent)
(Billions of dollars)
(Billions of dollars)
7.
65
30
-10
6
60
35
-5
55
40
4
50
45
3
45
50
10
40
55
15
Given the information in the preceding table, use the blue points (circle symbol) to plot the demand for loanable funds. Next, use the orange points
(square symbol) to plot the supply of loanable funds. Finally, use the black point (cross symbol) to indicate the equilibrium in this market.
Market for Loanable Funds
Demand
Expert Solution
This question has been solved!
Explore an expertly crafted, step-by-step solution for a thorough understanding of key concepts.

This is a popular solution!

Trending now
This is a popular solution!

Step by step
Solved in 2 steps with 1 images

Knowledge Booster


Learn more about
Need a deep-dive on the concept behind this application? Look no further. Learn more about this topic, economics and related others by exploring similar questions and additional content below.Recommended textbooks for you
Principles of Economics 2e
Economics
ISBN:
9781947172364
Author:
Steven A. Greenlaw; David Shapiro
Publisher:
OpenStax

Brief Principles of Macroeconomics (MindTap Cours…
Economics
ISBN:
9781337091985
Author:
N. Gregory Mankiw
Publisher:
Cengage Learning
Principles of Economics 2e
Economics
ISBN:
9781947172364
Author:
Steven A. Greenlaw; David Shapiro
Publisher:
OpenStax
Brief Principles of Macroeconomics (MindTap Cours…
Economics
ISBN:
9781337091985
Author:
N. Gregory Mankiw
Publisher:
Cengage Learning