Supply Quantity Supplied (Sedans per month) 30 495 25 20 Supply Shifters 15 Robot Speed (Bolts per hour) 1500 10 Autoworker Wage (Dollars per hour) 5 30 100 200 300 400 500 600 700 800 900 QUANTITY (Sedans per month) Suppose that the price of sedans in the previous graph decreases from $26,000 to $21,000 per car. This would cause the sedans to decrease, which is reflected on the graph by a the supply curve. Suppose the workers' union accepts a pay cut from $30 per hour to $25 per hour. Assuming that the robot speed remains the same, this would cause a the supply curve. This is because the pay cut makes cars PRICE (Thousands of doll.
Supply Quantity Supplied (Sedans per month) 30 495 25 20 Supply Shifters 15 Robot Speed (Bolts per hour) 1500 10 Autoworker Wage (Dollars per hour) 5 30 100 200 300 400 500 600 700 800 900 QUANTITY (Sedans per month) Suppose that the price of sedans in the previous graph decreases from $26,000 to $21,000 per car. This would cause the sedans to decrease, which is reflected on the graph by a the supply curve. Suppose the workers' union accepts a pay cut from $30 per hour to $25 per hour. Assuming that the robot speed remains the same, this would cause a the supply curve. This is because the pay cut makes cars PRICE (Thousands of doll.

Chapter4: Supply And Demand: An Initial Look
Section: Chapter Questions
Problem 2TY

Related questions
Question
Choices for lablled parts
1. Supply or quantity supplied
2. movement along or shift of
3. rightward shift of, leftward movement along, leftward shift of, rightward movement along
4. Less expensive to build, more fashionable, more expensive to build, safer
Transcribed Image Text:dollars)
35
Supply
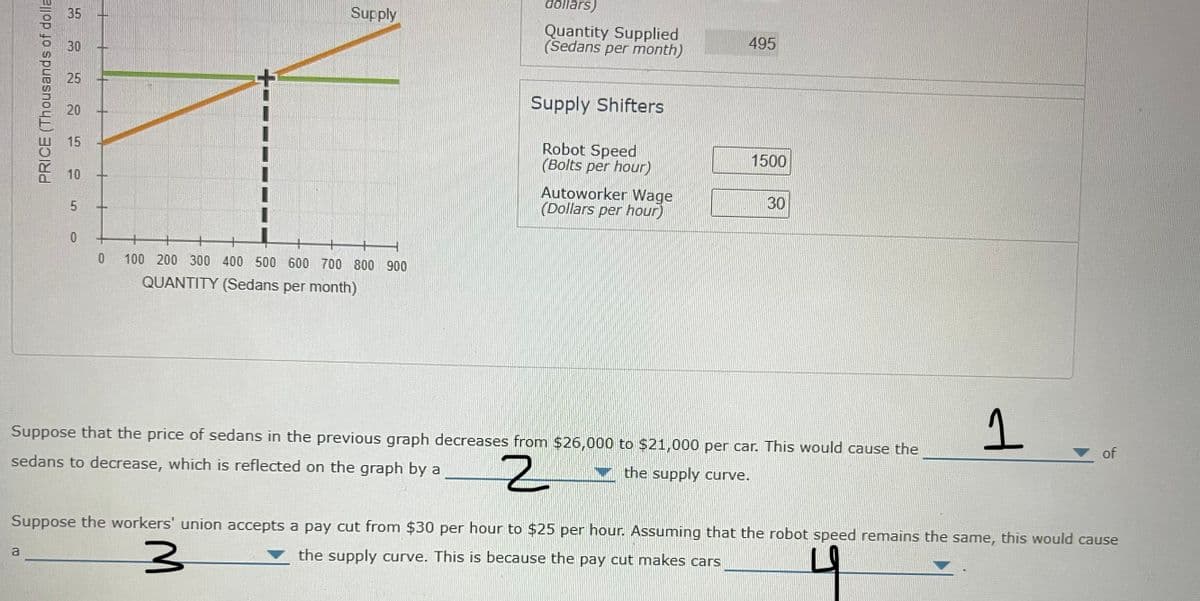
Quantity Supplied
(Sedans per month)
495
30
25
Supply Shifters
20
Robot Speed
(Bolts per hour)
15
1500
10
Autoworker Wage
(Dollars per hour)
30
100 200 300 400 500 600 700 800 900
QUANTITY (Sedans per month)
Suppose that the price of sedans in the previous graph decreases from $26,000 to $21,000 per car. This would cause the
of
sedans to decrease, which is reflected on the graph by a
V the supply curve.
Suppose the workers' union accepts a pay cut from $30 per hour to $25 per hour. Assuming that the robot speed remains the same, this would cause
a
the supply curve. This is because the pay cut makes cars
PRICE (Thousands of dolla
5.
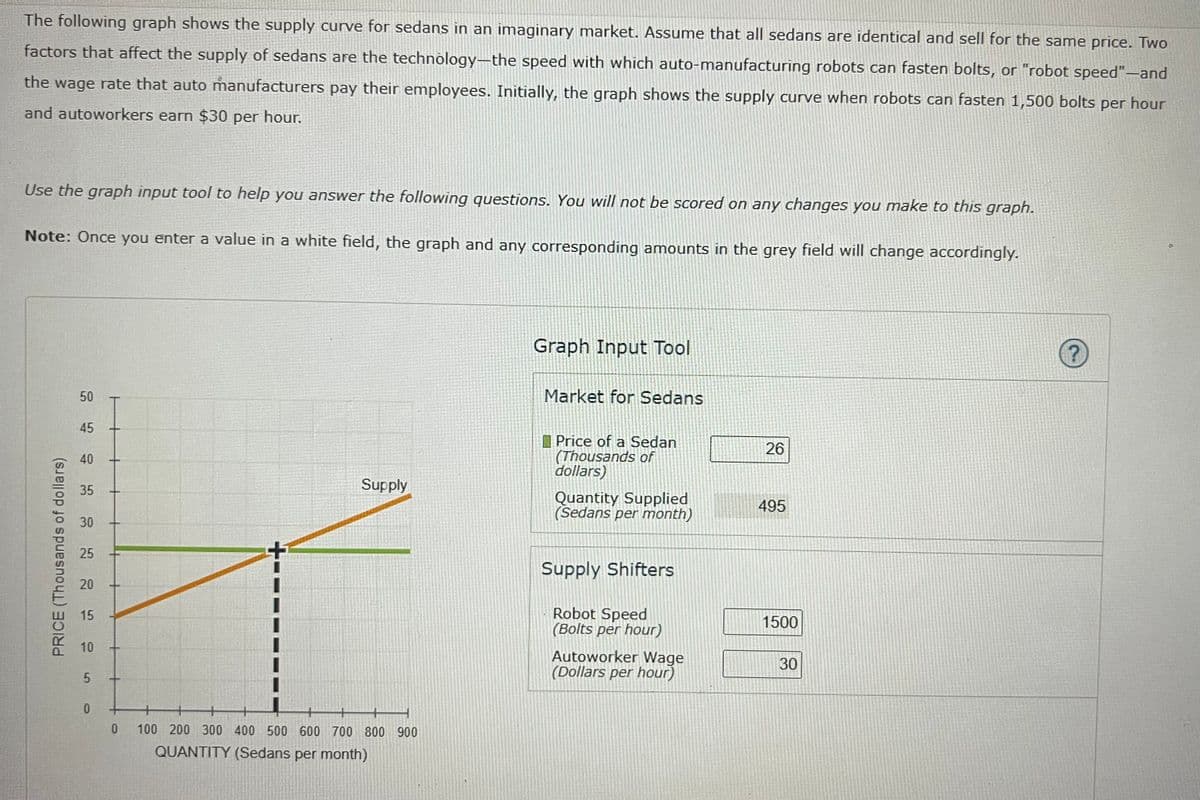
Transcribed Image Text:The following graph shows the supply curve for sedans in an imaginary market. Assume that all sedans are identical and sell for the same price. Two
factors that affect the supply of sedans are the technology–the speed with which auto-manufacturing robots can fasten bolts, or "robot speed"-and
the wage rate that auto manufacturers pay their employees. Initially, the graph shows the supply curve when robots can fasten 1,500 bolts per hour
and autoworkers earn $30 per hour.
Use the graph input tool to help you answer the following questions. You will not be scored on any changes you make to this graph.
Note: Once you enter a value in a white field, the graph and any corresponding amounts in the grey field will change accordingly.
Graph Input Tol
1?
50
Market for Sedans
45
I Price of a Sedan
(Thousands of
dollars)
26
Supply
Quantity Supplied
(Sedans per month)
495
30
25
Supply Shifters
20
Robot Speed
(Bolts per hour)
15
1500
10
Autoworker Wage
(Dollars per hour)
30
100 200 300 400 500 600 700 800 900
QUANTITY (Sedans per month)
40
35
PRICE (Thousands of dollars)
Expert Solution
This question has been solved!
Explore an expertly crafted, step-by-step solution for a thorough understanding of key concepts.

This is a popular solution!

Trending now
This is a popular solution!

Step by step
Solved in 2 steps

Knowledge Booster


Learn more about
Need a deep-dive on the concept behind this application? Look no further. Learn more about this topic, economics and related others by exploring similar questions and additional content below.Recommended textbooks for you

Principles of Economics 2e
Economics
ISBN:
9781947172364
Author:
Steven A. Greenlaw; David Shapiro
Publisher:
OpenStax

Exploring Economics
Economics
ISBN:
9781544336329
Author:
Robert L. Sexton
Publisher:
SAGE Publications, Inc
Principles of Economics 2e
Economics
ISBN:
9781947172364
Author:
Steven A. Greenlaw; David Shapiro
Publisher:
OpenStax
Exploring Economics
Economics
ISBN:
9781544336329
Author:
Robert L. Sexton
Publisher:
SAGE Publications, Inc


