Suppose a candy company representative claims that colored candies are mixed such thateach large production batch has precisely the following proportions: 20% brown, 20% yellow, 10% red, 10% orange, 20% green, and 20% blue. The colors present in a sample of 461 candies was recorded. Is the representative's claim about the expected proportions of each color refuted by the data? Color brown yellow red orange green blue Number of Candies 103 34 115 83 57 69 Step 1. State the null and alternative hypothesis. Step 2. What does the null hypothesis indicate about the proportions of candies of each color? Step 3. State the null and alternative hypothesis in terms of the expected proportions for each category. Step 4. Find the expected value for the number of chocolate candies colored brown. Round your answer to two decimal places. Step 5. Find the expected value for the number of chocolate candies colored orange. Round your answer to two decimal places. Step 6. Find the value of the test statistic. Round your answer to three decimal places. Step 7. Find the degrees of freedom associated with the test statistic for this problem. Step 8. Find the critical value of the test at the 0.01 level of significance. Round your answer to three decimal places. Step 9. Make the decision to reject or fail to reject the null hypothesis at the 0.01 level of significance. Step 10. State the conclusion of the hypothesis test at the 0.01 level of significance


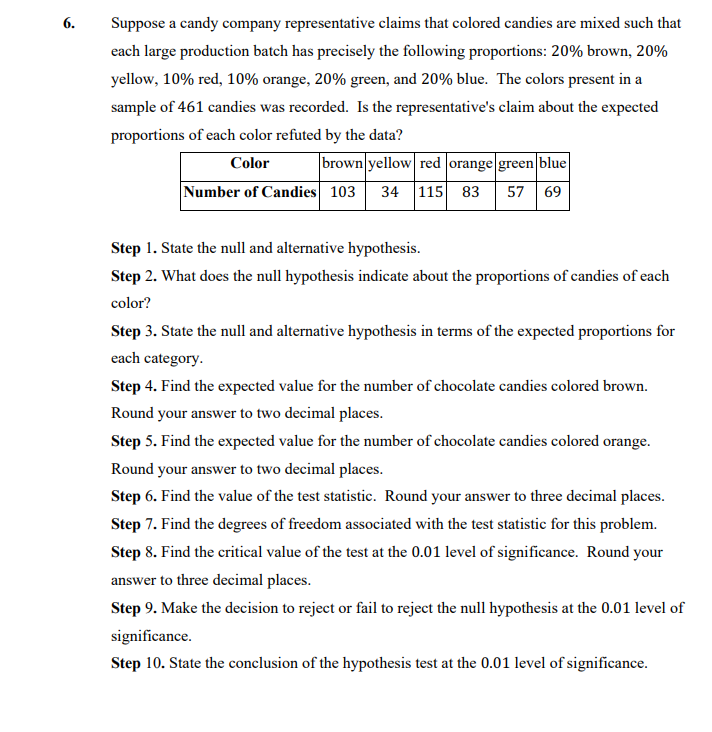
6. Suppose a candy company representative claims that colored candies are mixed such thateach large production batch has precisely the following proportions: 20% brown, 20% yellow, 10% red, 10% orange, 20% green, and 20% blue. The colors present in a sample of 461 candies was recorded. Is the representative's claim about the expected proportions of each color refuted by the data? Color brown yellow red orange green blue Number of Candies 103 34 115 83 57 69
Step 1. State the null and alternative hypothesis.
Step 2. What does the null hypothesis indicate about the proportions of candies of each color?
Step 3. State the null and alternative hypothesis in terms of the expected proportions for each category.
Step 4. Find the
Step 5. Find the expected value for the number of chocolate candies colored orange. Round your answer to two decimal places.
Step 6. Find the value of the test statistic. Round your answer to three decimal places.
Step 7. Find the degrees of freedom associated with the test statistic for this problem.
Step 8. Find the critical value of the test at the 0.01 level of significance. Round your answer to three decimal places.
Step 9. Make the decision to reject or fail to reject the null hypothesis at the 0.01 level of significance.
Step 10. State the conclusion of the hypothesis test at the 0.01 level of significance


Trending now
This is a popular solution!

Step by step
Solved in 4 steps with 10 images


