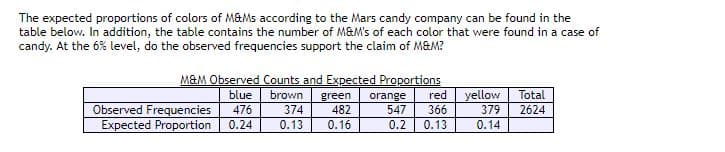
The expected proportions of colors of M&Ms according to the Mars candy company can be found in the table below. In addition, the table contains the number of M&M's of each color that were found in a case of candy. At the 6% level, do the observed frequencies support the claim of M&M? MAM Observed Counts and Expected Proportions brown 374 0.13 blue 476 0.24 yellow 379 0.14 Total 2624 red Observed Frequencies Expected Proportion green 482 0.16 orange 547 0.2 366 0.13
The expected proportions of colors of M&Ms according to the Mars candy company can be found in the table below. In addition, the table contains the number of M&M's of each color that were found in a case of candy. At the 6% level, do the observed frequencies support the claim of M&M? MAM Observed Counts and Expected Proportions brown 374 0.13 blue 476 0.24 yellow 379 0.14 Total 2624 red Observed Frequencies Expected Proportion green 482 0.16 orange 547 0.2 366 0.13

Glencoe Algebra 1, Student Edition, 9780079039897, 0079039898, 2018
18th Edition
ISBN:9780079039897
Author:Carter
Publisher:Carter
Chapter10: Statistics
Section: Chapter Questions
Problem 13PT

Related questions

Concept explainers
Equations and Inequations
Equations and inequalities describe the relationship between two mathematical expressions.
Linear Functions
A linear function can just be a constant, or it can be the constant multiplied with the variable like x or y. If the variables are of the form, x2, x1/2 or y2 it is not linear. The exponent over the variables should always be 1.
Question
problem attached. please do full problem thx!
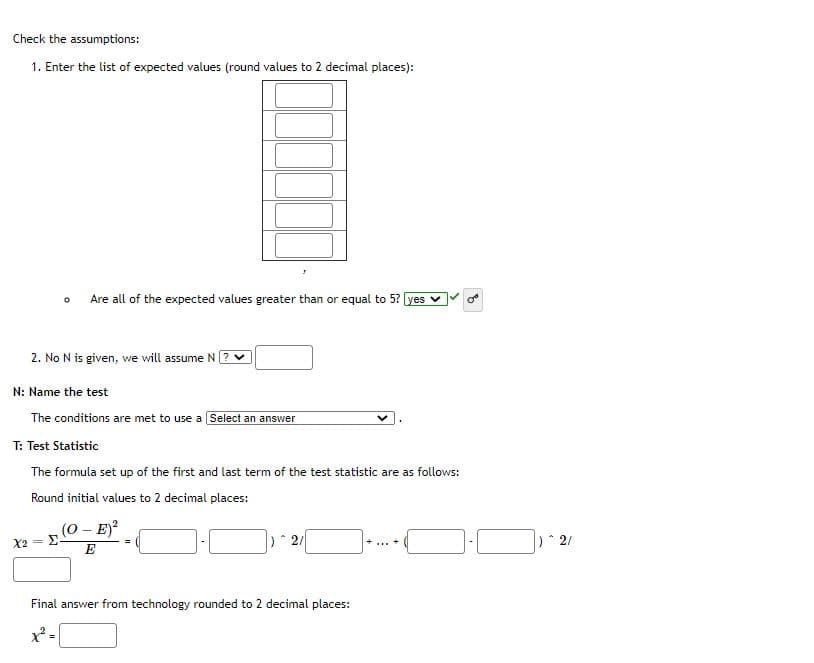
Transcribed Image Text:Check the assumptions:
1. Enter the list of expected values (round values to 2 decimal places):
Are all of the expected values greater than or equal to 5? yes
2. No N is given, we will assume N
N: Name the test
The conditions are met to use a Select an answer
T: Test Statistic
The formula set up of the first and last term of the test statistic are as follows:
Round initial values to 2 decimal places:
(0- E)
X2
E
Final answer from technology rounded to 2 decimal places:
Transcribed Image Text:The expected proportions of colors of M&Ms according to the Mars candy company can be found in the
table below. In addition, the table contains the number of M&M's of each color that were found in a case of
candy. At the 6% level, do the observed frequencies support the claim of M&M?
M&M Observed Counts and Expected Proportions
blue
brown
red
yellow
Total
green
482
orange
547
Observed Frequencies
Expected Proportion
476
374
366
379
2624
0.24
0.13
0.16
0.2
0.13
0.14
Expert Solution
This question has been solved!
Explore an expertly crafted, step-by-step solution for a thorough understanding of key concepts.

This is a popular solution!

Trending now
This is a popular solution!

Step by step
Solved in 2 steps with 3 images

Knowledge Booster


Learn more about
Need a deep-dive on the concept behind this application? Look no further. Learn more about this topic, statistics and related others by exploring similar questions and additional content below.Recommended textbooks for you
Glencoe Algebra 1, Student Edition, 9780079039897…
Algebra
ISBN:
9780079039897
Author:
Carter
Publisher:
McGraw Hill

Algebra & Trigonometry with Analytic Geometry
Algebra
ISBN:
9781133382119
Author:
Swokowski
Publisher:
Cengage

Holt Mcdougal Larson Pre-algebra: Student Edition…
Algebra
ISBN:
9780547587776
Author:
HOLT MCDOUGAL
Publisher:
HOLT MCDOUGAL
Glencoe Algebra 1, Student Edition, 9780079039897…
Algebra
ISBN:
9780079039897
Author:
Carter
Publisher:
McGraw Hill
Algebra & Trigonometry with Analytic Geometry
Algebra
ISBN:
9781133382119
Author:
Swokowski
Publisher:
Cengage
Holt Mcdougal Larson Pre-algebra: Student Edition…
Algebra
ISBN:
9780547587776
Author:
HOLT MCDOUGAL
Publisher:
HOLT MCDOUGAL

College Algebra
Algebra
ISBN:
9781305115545
Author:
James Stewart, Lothar Redlin, Saleem Watson
Publisher:
Cengage Learning