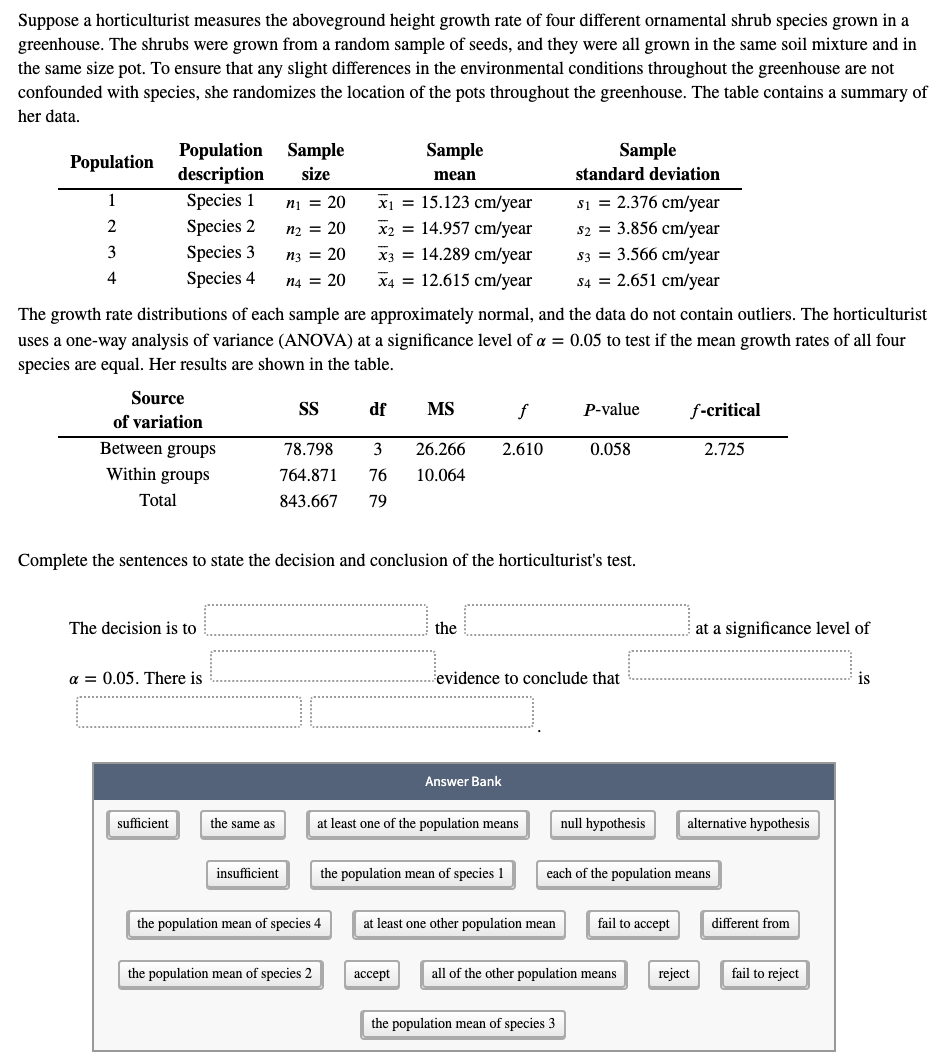
Suppose a horticulturist measures the aboveground height growth rate of four different ornamental shrub species grown in a greenhouse. The shrubs were grown from a random sample of seeds, and they were all grown in the same soil mixture and in the same size pot. To ensure that any slight differences in the environmental conditions throughout the greenhouse are not confounded with species, she randomizes the location of the pots throughout the greenhouse. The table contains a summary her data. Population Sample description Sample Sample standard deviation Population size mean x1 = 15.123 cm/year x2 = 14.957 cm/year x3 = 14.289 cm/year X4 = 12.615 cm/year s1 = 2.376 cm/year s2 = 3.856 cm/year $3 = 3.566 cm/year S4 = 2.651 cm/year 1 Species 1 nį = 20 2 Species 2 n2 = 20 Species 3 Species 4 3 n3 = 20 %3D 4 n4 = 20 The growth rate distributions of each sample are approximately normal, and the data do not contain outliers. The horticulturi uses a one-way analysis of variance (ANOVA) at a significance level of a = 0.05 to test if the mean growth rates of all four species are equal. Her results are shown in the table. Source S df MS f P-value f-critical of variation Between groups 78.798 3 26.266 2.610 0.058 2.725 Within groups 764.871 76 10.064 Total 843.667 79 Complete the sentences to state the decision and conclusion of the horticulturist's test. The decision is to the at a significance level of a = 0.05. There is evidence to conclude that is
Suppose a horticulturist measures the aboveground height growth rate of four different ornamental shrub species grown in a greenhouse. The shrubs were grown from a random sample of seeds, and they were all grown in the same soil mixture and in the same size pot. To ensure that any slight differences in the environmental conditions throughout the greenhouse are not confounded with species, she randomizes the location of the pots throughout the greenhouse. The table contains a summary her data. Population Sample description Sample Sample standard deviation Population size mean x1 = 15.123 cm/year x2 = 14.957 cm/year x3 = 14.289 cm/year X4 = 12.615 cm/year s1 = 2.376 cm/year s2 = 3.856 cm/year $3 = 3.566 cm/year S4 = 2.651 cm/year 1 Species 1 nį = 20 2 Species 2 n2 = 20 Species 3 Species 4 3 n3 = 20 %3D 4 n4 = 20 The growth rate distributions of each sample are approximately normal, and the data do not contain outliers. The horticulturi uses a one-way analysis of variance (ANOVA) at a significance level of a = 0.05 to test if the mean growth rates of all four species are equal. Her results are shown in the table. Source S df MS f P-value f-critical of variation Between groups 78.798 3 26.266 2.610 0.058 2.725 Within groups 764.871 76 10.064 Total 843.667 79 Complete the sentences to state the decision and conclusion of the horticulturist's test. The decision is to the at a significance level of a = 0.05. There is evidence to conclude that is

Holt Mcdougal Larson Pre-algebra: Student Edition 2012
1st Edition
ISBN:9780547587776
Author:HOLT MCDOUGAL
Publisher:HOLT MCDOUGAL
Chapter11: Data Analysis And Probability
Section: Chapter Questions
Problem 8CR

Related questions
Topic Video
Question
Transcribed Image Text:Suppose a horticulturist measures the aboveground height growth rate of four different ornamental shrub species grown in a
greenhouse. The shrubs were grown from a random sample of seeds, and they were all grown in the same soil mixture and in
the same size pot. To ensure that any slight differences in the environmental conditions throughout the greenhouse are not
confounded with species, she randomizes the location of the pots throughout the greenhouse. The table contains a summary of
her data.
Population Sample
description
Species 1
Sample
Sample
Population
size
mean
standard deviation
x1 = 15.123 cm/year
x2 = 14.957 cm/year
1
s1 = 2.376 cm/year
s2 = 3.856 cm/year
s3 = 3.566 cm/year
ni = 20
Species 2
nz = 20
3
Species 3
n3 = 20
X3 = 14.289 cm/year
4
Species 4
n4 = 20
x4 = 12.615 cm/year
$4 = 2.651 cm/year
The growth rate distributions of each sample are approximately normal, and the data do not contain outliers. The horticulturist
uses a one-way analysis of variance (ANOVA) at a significance level of a = 0.05 to test if the mean growth rates of all four
species are equal. Her results are shown in the table.
Source
SS
df
MS
P-value
f-critical
of variation
Between groups
78.798
3
26.266
2.610
0.058
2.725
Within groups
764.871
10.064
76
Total
843.667
79
Complete the sentences to state the decision and conclusion of the horticulturist's test.
The decision is to
the
at a significance level of
a = 0.05. There is
evidence to conclude that
is
Answer Bank
sufficient
the same as
at least one of the population means
null hypothesis
alternative hypothesis
insufficient
the population mean of species 1
each of the
tion means
the population mean of species 4
at least one other population mean
fail to accept
different from
the population mean of species 2
ассept
all of the other population means
reject
fail to reject
the population mean of species 3
Expert Solution
This question has been solved!
Explore an expertly crafted, step-by-step solution for a thorough understanding of key concepts.

This is a popular solution!

Trending now
This is a popular solution!

Step by step
Solved in 2 steps with 1 images

Knowledge Booster


Learn more about
Need a deep-dive on the concept behind this application? Look no further. Learn more about this topic, statistics and related others by exploring similar questions and additional content below.Recommended textbooks for you
Holt Mcdougal Larson Pre-algebra: Student Edition…
Algebra
ISBN:
9780547587776
Author:
HOLT MCDOUGAL
Publisher:
HOLT MCDOUGAL
Holt Mcdougal Larson Pre-algebra: Student Edition…
Algebra
ISBN:
9780547587776
Author:
HOLT MCDOUGAL
Publisher:
HOLT MCDOUGAL