Suppose a life insurance company sells a $200,000 1-year term life insurance policy to a 20-year-old female for $300. According to the Nationa Vital Statistics Report, 58(21), the probability that the female survives the year is 0.999544. Compute and interpret the expected value of this policy to the insurance company. The expected value is S (Round to the nearest cent as needed.) Which of the following interpretations of the expected value is correct? Select the correct choice below and fill in the answer box to complete your choice. (Round to the nearest cent as needed.) O A. The insurance company expects to make a maximum profit of $ on every 20-year-old female it insures for 1 year. O B. The insurance company expects to make a profit of $ on every 20-year-old female it insures for 1 month. O C. The insurance company expects to make a minimum profit of S on every 20-year-old female it insures for 1 month. O D. The insurance company expects to make a profit of $ on every 20-year-old female it insures for 1 year.
Suppose a life insurance company sells a $200,000 1-year term life insurance policy to a 20-year-old female for $300. According to the Nationa Vital Statistics Report, 58(21), the probability that the female survives the year is 0.999544. Compute and interpret the expected value of this policy to the insurance company. The expected value is S (Round to the nearest cent as needed.) Which of the following interpretations of the expected value is correct? Select the correct choice below and fill in the answer box to complete your choice. (Round to the nearest cent as needed.) O A. The insurance company expects to make a maximum profit of $ on every 20-year-old female it insures for 1 year. O B. The insurance company expects to make a profit of $ on every 20-year-old female it insures for 1 month. O C. The insurance company expects to make a minimum profit of S on every 20-year-old female it insures for 1 month. O D. The insurance company expects to make a profit of $ on every 20-year-old female it insures for 1 year.

Chapter8: Sequences, Series,and Probability
Section8.7: Probability
Problem 11ECP: A manufacturer has determined that a machine averages one faulty unit for every 500 it produces....

Related questions

Concept explainers
Contingency Table
A contingency table can be defined as the visual representation of the relationship between two or more categorical variables that can be evaluated and registered. It is a categorical version of the scatterplot, which is used to investigate the linear relationship between two variables. A contingency table is indeed a type of frequency distribution table that displays two variables at the same time.
Binomial Distribution
Binomial is an algebraic expression of the sum or the difference of two terms. Before knowing about binomial distribution, we must know about the binomial theorem.
Topic Video
Question
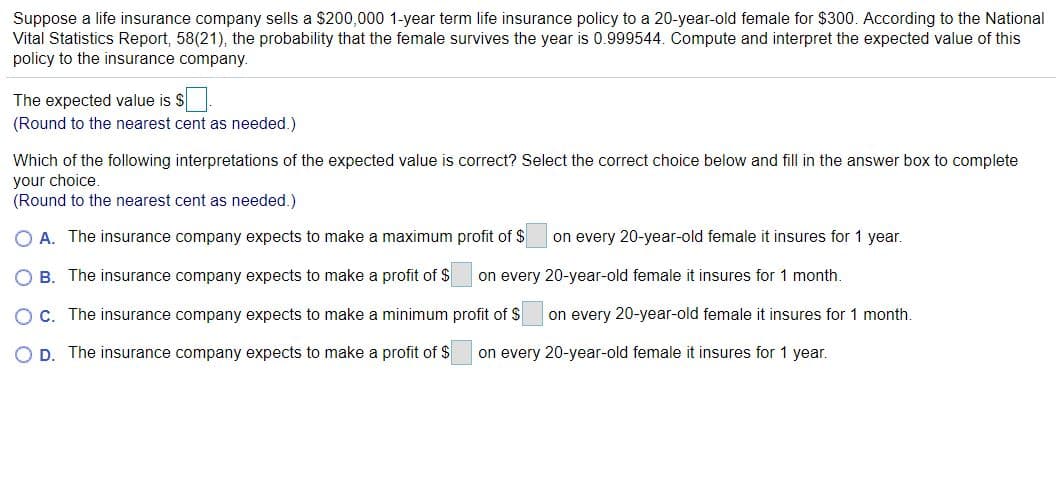
Transcribed Image Text:Suppose a life insurance company sells a $200,000 1-year term life insurance policy to a 20-year-old female for $300. According to the National
Vital Statistics Report, 58(21), the probability that the female survives the year is 0.999544. Compute and interpret the expected value of this
policy to the insurance company.
The expected value is $
(Round to the nearest cent as needed.)
Which of the following interpretations of the expected value is correct? Select the correct choice below and fill in the answer box to complete
your choice.
(Round to the nearest cent as needed.)
O A. The insurance company expects to make a maximum profit of $
on every 20-year-old female it insures for 1 year.
O B. The insurance company expects to make a profit of $
on every 20-year-old female it insures for 1 month.
OC. The insurance company expects to make a minimum profit of S
on every 20-year-old female it insures for 1 month.
D. The insurance company expects to make a profit of $
on every 20-year-old female it insures for 1 year.
O O O
Expert Solution
This question has been solved!
Explore an expertly crafted, step-by-step solution for a thorough understanding of key concepts.

This is a popular solution!

Trending now
This is a popular solution!

Step by step
Solved in 2 steps with 1 images

Knowledge Booster


Learn more about
Need a deep-dive on the concept behind this application? Look no further. Learn more about this topic, statistics and related others by exploring similar questions and additional content below.Recommended textbooks for you

Algebra & Trigonometry with Analytic Geometry
Algebra
ISBN:
9781133382119
Author:
Swokowski
Publisher:
Cengage
Algebra & Trigonometry with Analytic Geometry
Algebra
ISBN:
9781133382119
Author:
Swokowski
Publisher:
Cengage