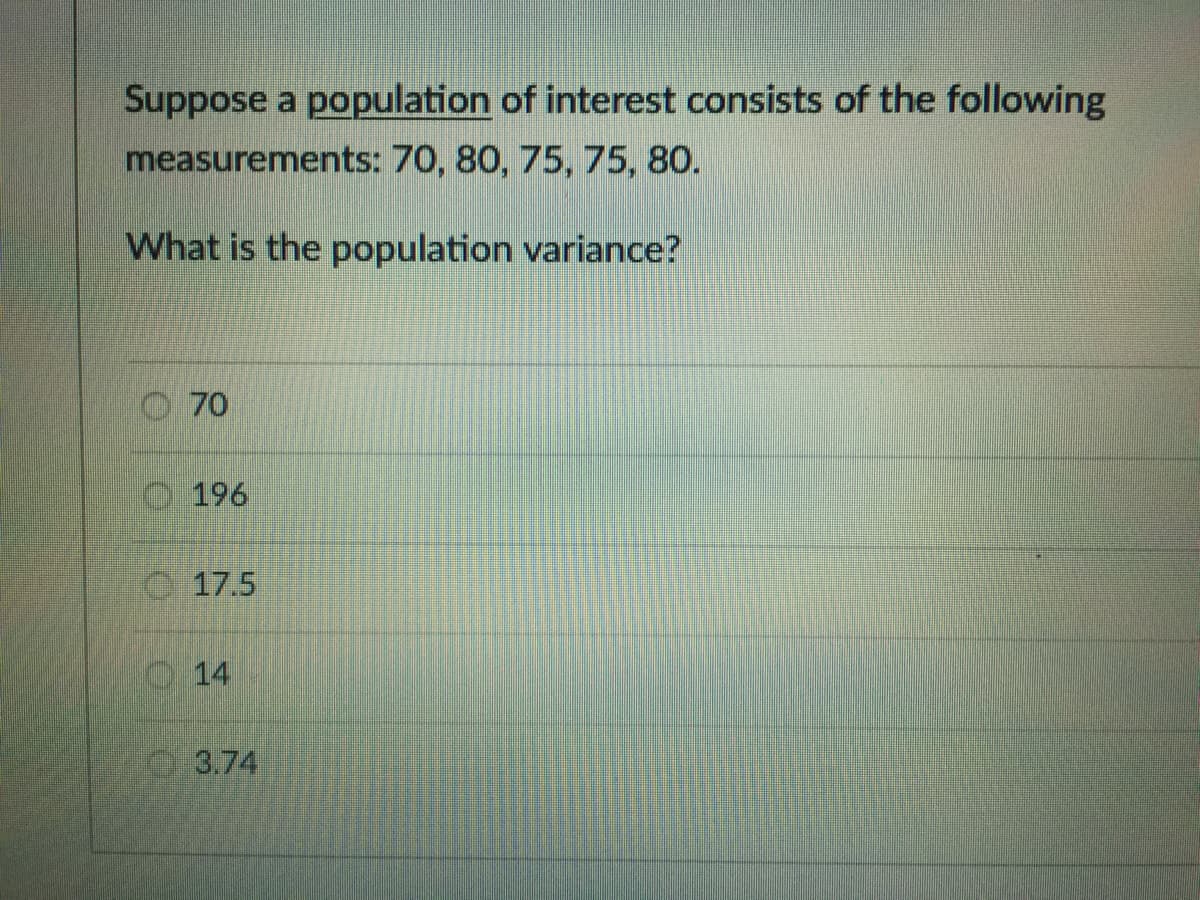
Suppose a population of interest consists of the following measurements: 70, 80, 75, 75, 80. What is the population variance? O 70 O196 O 17.5 3.74


Q: Suppose a random sample size of 60 is taken from a population with p = 0.51. What is the mean of…
A:
Q: Given a normally distributed population with a mean of 100 and variance 100, find ) P(90 sxs 115) 9)…
A: As per our company guidelines we are supposed to answer only first 3 sub-parts. Kindly repost other…
Q: Compute Quartile Deviation of the following data: Wages 100 140 180 200 240 300 320 Workers 10 16 14…
A: Given data is Wages 100 140 180 200 240 300 320 Workers 5 7 10 16 14 8 4
Q: If the correlation coefficient between variables is .60, how much of the variance is unexplained by…
A:
Q: If an analysis of variance is used for the following data, what would be the effect of changing the…
A: The given sample data is as follows: M1 = 10, M2 = 20, SS1 = 90, and SS2 = 70. The value of M2 is…
Q: 2. The following are the scores in Math of the sampled 15 Grade 10 students: 60 61 58 70 62 74 75 78…
A:
Q: This assignment will assess your ability to calculate the mean, median, mode, variance, and standard…
A: Given: Sample size n = 63 Formula Used: Sample variance s2 = ∑i=1n(Xi-X)2n-1 Where, X is a sample…
Q: Consider the following frequency distribution. Class Frequency 2 up to 4 24 4 up to 6 56 6…
A: Variance and standard deviation:
Q: Consider the following sample data. Sample A: 4, 9, 14 Sample B: 75, se, 85 Sample C: 1,e7e; 1,875;…
A: Measure of central tendency measures the central or average value of a dataset. Measured of…
Q: A survey was conducted to find the number of cars each household owns in a particular subdivision.…
A: Answer: Option A. 0.89.
Q: II. Which of the following samples is a good representative of the described population? Why?
A: Simple random sample is when the items are randomly selected from the whole data.
Q: Consider the following following frequency table Class frequency 1- 5 7 6 – 10 7 11 – 15 4 16 – 20…
A:
Q: This assignment will assess your ability to calculate the mean, median, mode, variance, and standard…
A: Measure of central tendency is used to measure the average of the data set. Measures of central…
Q: Which of the following values will give us the most relevant information about a particular group of…
A: Hint: Different data sets may have the same mean. So, the Mean is not enough to get the relevant…
Q: Consider the following frequency distribution for a sample of 20 observations Class 0 < 5 5 < 10 10…
A: Given Data: Class Midpoint (x) Frequency (f) (x-mean)2 f (x-mean)2 0-5 2.5 5 36 180 5-10 7.5…
Q: 2. Find the range and sample variance of the following numbers: 12 13 45 16 12 12 10 10 13 15 3.…
A: For the given data Find ( 2 ) Range =? Sample variance =? ( 3 ) popultion s.d =? Sample s.d =? ( 4 )…
Q: Consider the following frequency distribution for a sample of 20 observations Class 0 <5 5< 10 10 <…
A: The table helps to find the sample variance. Interval Frequency Mid-point ∑f(x-x-bar)^2 0<5…
Q: The ages (in years) of a random sample of shoppers at a gaming store are given below: 12 21 23 15 20…
A: Observation: XX X^2X2 1 12 144 2 21 441 3 23 529 4 15 225 5 20 400 6 16 256 7 19 361…
Q: The owner of a manufacturing plant employs eighty people. As part of their personnel file, she asked…
A:
Q: Consider a sample with data values of 10, 40, 60, 80, 90. Compute the variance. Select one: O a.…
A: Here we want to find sample variance
Q: In the formula for an analysis of variance, we want between-group variance to be and within group…
A:
Q: Compute the population variance of the data: 16,18,23,21,17,16,24,23,9,17,11,16,22,10,15,14. A.…
A: σ2= ∑(xi-x¯)2n
Q: If an analysis of variance is used for the following data, what would be the effect of changing the…
A: F-ratio is interpreted as the ratio of mean sum of squares between and mean sum of squares within.…
Q: Find the variance for the population consisting of the measurements ½, ¼, 1/3, ½, and 1/8 by using…
A: The population mean is, μ=∑XN=12+6+8+12+35=415=8.2 The population mean is 8.2.
Q: Given the following information, calculate the pooled sample variance that should be used in the…
A:
Q: Which of the following values will give us the most relevant information about a particular group of…
A: Sol:- Correct option :-
Q: Given the following observations : answer questions from 9-10: 408 401 410 415 390 400 395 450 406…
A:
Q: 1. Find the variance and the standard deviation of the following admission test results of ten (10)…
A: Note: Please repost 2nd question as i can author only one question as per my policy. Given…
Q: Find the variance of the following data set. 9, 6, 8, 8 NOTE: Round your answer to TWO decimal…
A: Given data set is 9,6,8,8
Q: Find the coefficient of variation (CV) of the following data using sample variance. Use 3 decimal…
A:
Q: If an analysis of variance is used for the following data, what would be the effect of changing the…
A: The formula for sum of square between is, SSbetween=∑iMi-M¯2 When the value of M2 is increased from…
Q: Compute the population variance for the following sample data, assuming the sample comprises the…
A:
Q: Consider the following frequency distribution for a sample of 20 observations Class 0<5 5 < 10 10 <…
A: Variance= E(X2)- (E(X))2 Where E(X)= summation (f*X)/(summation f) E(X2)= (Summation…
Q: Assuming you have data for a variable with 2,000 values, using the 2K > n guideline, what is the…
A: 2 to the k rule: Consider that k is the number of classes and n is the number of observations. Now,…
Q: Find the coefficient of variation (CV) of the following data using sample variance. Use 3 decimal…
A: The coefficient of variation is the ratio of standard deviation to the mean that is . The sample…
Q: Consider the following data set: 1, 7, 7, 2, 3, 5, 13, 17, 18, 12, 9, 15, 20, 20, 22, 25 f. Find the…
A:
Q: This assignment will assess your ability to calculate the mean, median, mode, variance, and standard…
A: Given data 234 210 261 265 175 191 308 295 253 220 234 232 189 208 202 159 304 275 305 308…
Q: Calculate Quartile Deviation and its Coefficient from the following data : Weight (in pounds) 120…
A:
Q: . The ungrouped data below shows the different temperatures measured during n experiment. Construct…
A: The objective is to construct a frequency table for the ungrouped data and calculate its mean,…
Q: 10. Given the following frequency table, the sample Variance (S') is 12 3 4 12 13 15 10
A: Obtain the value of the sample variance. The value of the sample variance is obtained below as…
Q: A technician collected the following data after measuring the heights of a sample of plants that…
A: The data of 12 observations of height of plants is given. The observations are 15.5, 15.6, 12.9,…
Q: Two samples of scores on a survey are as follows: Sample A: 107 6 8| 7 |9 Sample B: 18 310|112 7 27.…
A: We have given that, The data of sample B is, 18, 3, 10, 1, 12, 7 Then, We will find the variance…
Q: Given the following data: Data 1 Data 2 1 1 4 5 5 5 6 5 8 8…
A:
Q: Q) Consider the following ungrouped data: 18 11 22 19 24 24 23 10 11 16…
A: Mean is the average value around which the whole data set is concentrated. Mean for the set of 'n'…
Q: Consider the following frequency distribution for a sample of 20 observations Class 0<5 5 < 10 10 <…
A:
Q: Consider a sample with data values of 10, 40, 60, 80, 90. Compute the variance. Select one: O a. 824…
A: Given data are 10,40,60,80,90 We have to find the sample variance
Q: Below is a table showing the weights of packages arriving at a post office during a day. Weight (kg)…
A:
Q: 11. Find population variance and SD for the following data. 11 - 16 17 - 22 12 23 -28 20 29 -34 18…
A: Given : X f Nov-16 5 17-22 12 23-28 20 29-34 18 35-40 5
Q: State whether the effect size for a 1-point effect (M- = 1) is small, medium or large given the…
A: Effect size is: Effect size=M-μσ=1σ
Q: For the following Frequency Distribution: 1. Find Sample Variance 2. Find Mode
A: The given frequency distribution can be continuous frequency distribution as Class Interval (CI)…


Trending now
This is a popular solution!

Step by step
Solved in 3 steps
