Suppose a study reported that the average person watched 3.46 hours of television per day. A random sample of 15 people gave the number of hours of television watched per day shown. At the 5% significance level, do the data provide sufficient evidence to conclude that the amount of television watched per day last year by the average person differed from the value reported in the study? (Note: x= 4.587 hours and s= 1.451 hours.) Click here to view partial table of values of t Set up the hypotheses for the one-mean t-test. Ho: HV Ha: H ▼ The test statistic is t=. (Round to two decimal places as needed.) C Identify the critical value(s). Select the correct choice below and fill in the answer box within your choice. (Round to three decimal places as needed.) OA. The critical values are ±t/2 = ± OB. The critical value is t = OC. The critical value is t = 4.1 4.6 6.4 D 5.3 5.1 4.6 5.5 1.8 3.8 2.3 6.0 6.1 3.8 6.4 3.0
Suppose a study reported that the average person watched 3.46 hours of television per day. A random sample of 15 people gave the number of hours of television watched per day shown. At the 5% significance level, do the data provide sufficient evidence to conclude that the amount of television watched per day last year by the average person differed from the value reported in the study? (Note: x= 4.587 hours and s= 1.451 hours.) Click here to view partial table of values of t Set up the hypotheses for the one-mean t-test. Ho: HV Ha: H ▼ The test statistic is t=. (Round to two decimal places as needed.) C Identify the critical value(s). Select the correct choice below and fill in the answer box within your choice. (Round to three decimal places as needed.) OA. The critical values are ±t/2 = ± OB. The critical value is t = OC. The critical value is t = 4.1 4.6 6.4 D 5.3 5.1 4.6 5.5 1.8 3.8 2.3 6.0 6.1 3.8 6.4 3.0

Glencoe Algebra 1, Student Edition, 9780079039897, 0079039898, 2018
18th Edition
ISBN:9780079039897
Author:Carter
Publisher:Carter
Chapter4: Equations Of Linear Functions
Section4.5: Correlation And Causation
Problem 2CYU

Related questions
Question
100%
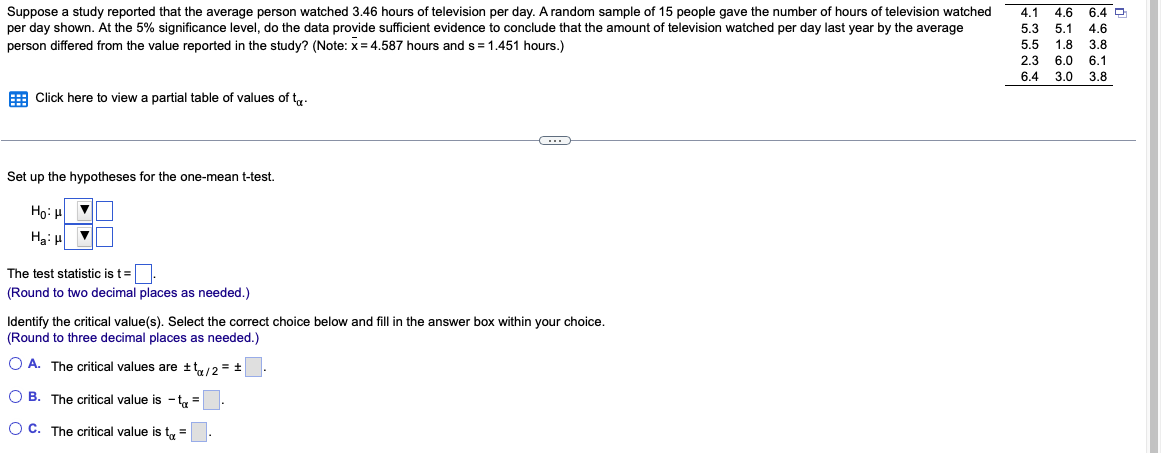
Transcribed Image Text:Suppose a study reported that the average person watched 3.46 hours of television per day. A random sample of 15 people gave the number of hours of television watched
per day shown. At the 5% significance level, do the data provide sufficient evidence to conclude that the amount of television watched per day last year by the average
person differed from the value reported in the study? (Note: x=4.587 hours and s= 1.451 hours.)
Click here to view partial table of values of t
Set up the hypotheses for the one-mean t-test.
Ho: HV
Ha: H
▼
The test statistic is t=.
(Round to two decimal places as needed.)
Identify the critical value(s). Select the correct choice below and fill in the answer box within your choice.
(Round to three decimal places as needed.)
OA. The critical values are ±t/2 = ±
OB. The critical value is t₁ =
OC. The critical value is t =
4.1 4.6 6.4 D
5.3 5.1 4.6
5.5 1.8 3.8
2.3 6.0 6.1
3.8
6.4 3.0
Expert Solution
This question has been solved!
Explore an expertly crafted, step-by-step solution for a thorough understanding of key concepts.

Step by step
Solved in 2 steps with 2 images

Recommended textbooks for you
Glencoe Algebra 1, Student Edition, 9780079039897…
Algebra
ISBN:
9780079039897
Author:
Carter
Publisher:
McGraw Hill

Functions and Change: A Modeling Approach to Coll…
Algebra
ISBN:
9781337111348
Author:
Bruce Crauder, Benny Evans, Alan Noell
Publisher:
Cengage Learning
Glencoe Algebra 1, Student Edition, 9780079039897…
Algebra
ISBN:
9780079039897
Author:
Carter
Publisher:
McGraw Hill
Functions and Change: A Modeling Approach to Coll…
Algebra
ISBN:
9781337111348
Author:
Bruce Crauder, Benny Evans, Alan Noell
Publisher:
Cengage Learning