Suppose Barefeet is a monopolist that produces and sells Ooh boots, an amazingly trendy brand with no close substitutes. The following graph shows the market demand and marginal revenue (MR) curves Barefeet faces, as well as its marginal cost (MC), which is constant at $30 per pair of Ooh boots. For simplicity, assume that fixed costs are equal to zero; this, combined with the fact that Barefeet's marginal cost is constant, means that its marginal cost curve is also equal to the average total cost (ATC) curve. First, suppose that Barefeet cannot price discriminate. That is, it must charge each consumer the same price for Ooh boots regardless of the consumer's willingness and ability to pay. On the following graph, use the black point (plus symbol) to indicate the profit-maximizing price and quantity. Next, use the purple points (diamond symbol) to shade the profit, the green points (triangle symbol) to shade the consumer surplus, and the black points (plus symbol) to shade the deadweight loss in this market without price discrimination. (Note: If you decide that consumer surplus, profit, or deadweight loss equals zero, indicate this by leaving that element in its original position on the palette.) 100 90 Monopoly Outcome 80 70 60 Consumer Surplus 50 40 Profit MC = ATC 30 20 Deadweight Loss 10 MR Demand 40 80 120 160 200 240 280 320 360 400 QUANTITY (Pairs of Ooh boots) PRICE (Dollars per pair of Ooh boots)
Suppose Barefeet is a monopolist that produces and sells Ooh boots, an amazingly trendy brand with no close substitutes. The following graph shows the market demand and marginal revenue (MR) curves Barefeet faces, as well as its marginal cost (MC), which is constant at $30 per pair of Ooh boots. For simplicity, assume that fixed costs are equal to zero; this, combined with the fact that Barefeet's marginal cost is constant, means that its marginal cost curve is also equal to the average total cost (ATC) curve. First, suppose that Barefeet cannot price discriminate. That is, it must charge each consumer the same price for Ooh boots regardless of the consumer's willingness and ability to pay. On the following graph, use the black point (plus symbol) to indicate the profit-maximizing price and quantity. Next, use the purple points (diamond symbol) to shade the profit, the green points (triangle symbol) to shade the consumer surplus, and the black points (plus symbol) to shade the deadweight loss in this market without price discrimination. (Note: If you decide that consumer surplus, profit, or deadweight loss equals zero, indicate this by leaving that element in its original position on the palette.) 100 90 Monopoly Outcome 80 70 60 Consumer Surplus 50 40 Profit MC = ATC 30 20 Deadweight Loss 10 MR Demand 40 80 120 160 200 240 280 320 360 400 QUANTITY (Pairs of Ooh boots) PRICE (Dollars per pair of Ooh boots)

Managerial Economics: Applications, Strategies and Tactics (MindTap Course List)
14th Edition
ISBN:9781305506381
Author:James R. McGuigan, R. Charles Moyer, Frederick H.deB. Harris
Publisher:James R. McGuigan, R. Charles Moyer, Frederick H.deB. Harris
Chapter13: best-practice Tactics: Game Theory
Section: Chapter Questions
Problem 1E

Related questions
Question
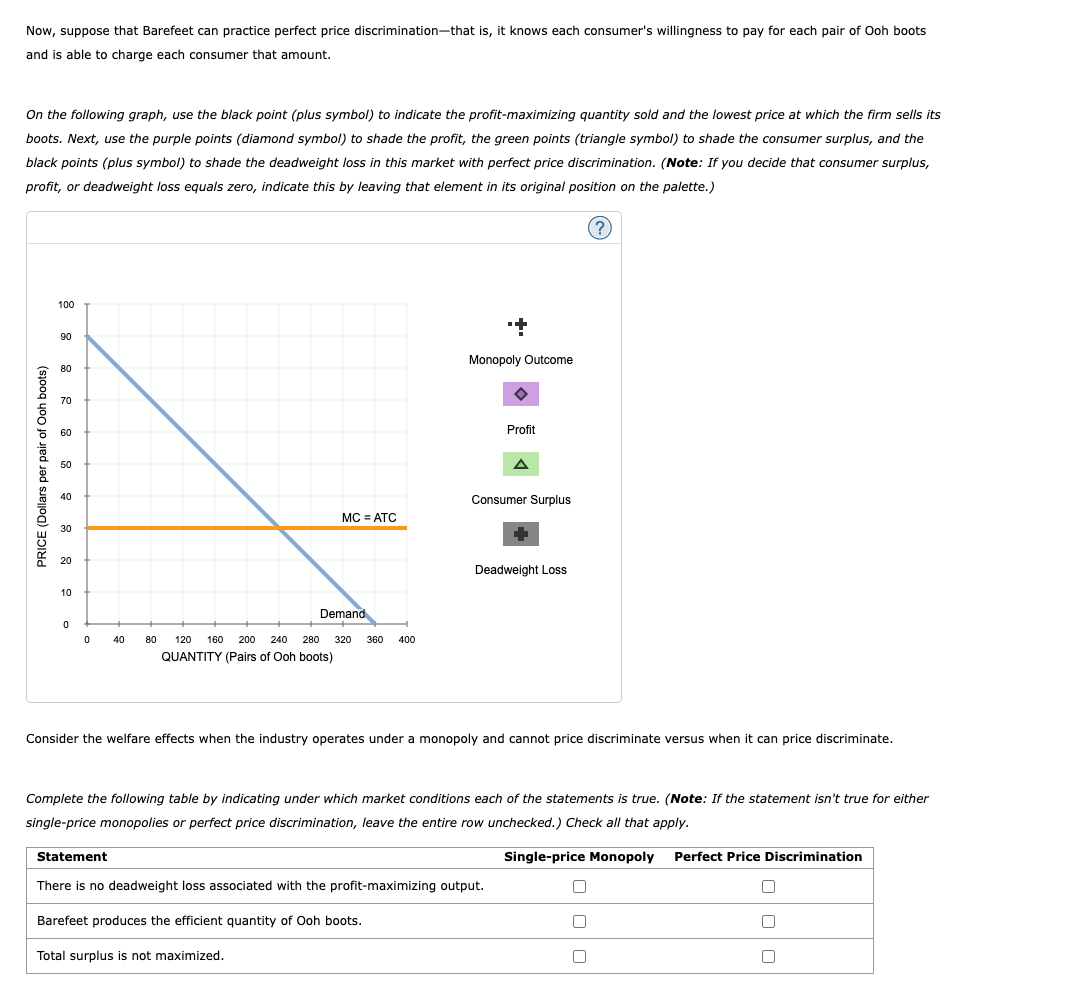
Transcribed Image Text:Now, suppose that Barefeet can practice perfect price discrimination-that is, it knows each consumer's willingness to pay for each pair of Ooh boots
and is able to charge each consumer that amount.
On the following graph, use the black point (plus symbol) to indicate the profit-maximizing quantity sold and the lowest price at which the firm sells its
boots. Next, use the purple points (diamond symbol) to shade the profit, the green points (triangle symbol) to shade the consumer surplus, and the
black points (plus symbol) to shade the deadweight loss in this market with perfect price discrimination. (Note: If you decide that consumer surplus,
profit, or deadweight loss equals zero, indicate this by leaving that element in its original position on the palette.)
100
90
Monopoly Outcome
80
70
60
Profit
50
40
Consumer Surplus
MC = ATC
30
20
Deadweight Loss
10
Demand
40
80
120
160
200
240
280
320
360
400
QUANTITY (Pairs of Ooh boots)
Consider the welfare effects when the industry operates under a monopoly and cannot price discriminate versus when it can price discriminate.
Complete the following table by indicating under which market conditions each of the statements is true. (Note: If the statement isn't true for either
single-price monopolies or perfect price discrimination, leave the entire row unchecked.) Check all that apply.
Statement
Single-price Monopoly
Perfect Price Discrimination
There is no deadweight loss associated with the profit-maximizing output.
Barefeet produces the efficient quantity of Ooh boots.
Total surplus is not maximized.
(si0og uoo JO JIed jad sJeIog) a0INe
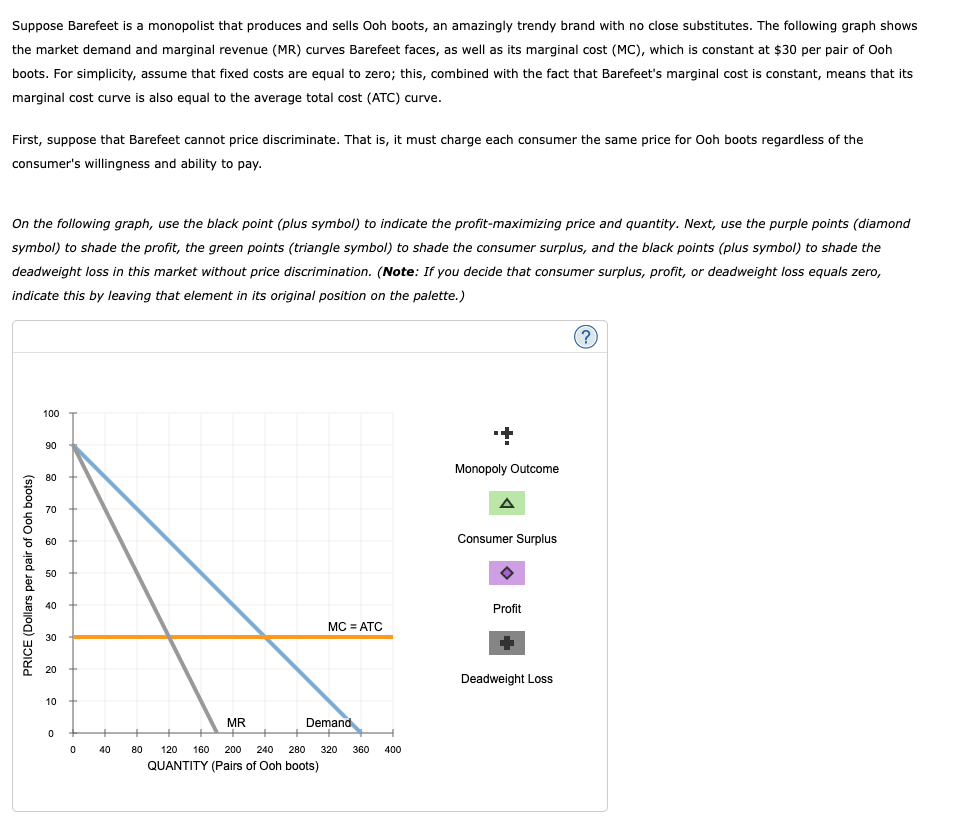
Transcribed Image Text:Suppose Barefeet is a monopolist that produces and sells Ooh boots, an amazingly trendy brand with no close substitutes. The following graph shows
the market demand and marginal revenue (MR) curves Barefeet faces, as well as its marginal cost (MC), which is constant at $30 per pair of Ooh
boots. For simplicity, assume that fixed costs are equal to zero; this, combined with the fact that Barefeet's marginal cost is constant, means that its
marginal cost curve is also equal to the average total cost (ATC) curve.
First, suppose that Barefeet cannot price discriminate. That is, it must charge each consumer the same price for Ooh boots regardless of the
consumer's willingness and ability to pay.
On the following graph, use the black point (plus symbol) to indicate the profit-maximizing price and quantity. Next, use the purple points (diamond
symbol) to shade the profit, the green points (triangle symbol) to shade the consumer surplus, and the black points (plus symbol) to shade the
deadweight loss in this market without price discrimination. (Note: If you decide that consumer surplus, profit, or deadweight loss equals zero,
indicate this by leaving that element in its original position on the palette.)
100
90
Monopoly Outcome
80
70
60
Consumer Surplus
50
40
Profit
MC = ATC
30
20
Deadweight Loss
10
MR
Demand
40
80
120
160
200
240
280
320
360
400
QUANTITY (Pairs of Ooh boots)
PRICE (Dollars per pair of Ooh boots)
Expert Solution
This question has been solved!
Explore an expertly crafted, step-by-step solution for a thorough understanding of key concepts.

This is a popular solution!

Trending now
This is a popular solution!

Step by step
Solved in 2 steps with 1 images

Knowledge Booster


Learn more about
Need a deep-dive on the concept behind this application? Look no further. Learn more about this topic, economics and related others by exploring similar questions and additional content below.Recommended textbooks for you
Managerial Economics: Applications, Strategies an…
Economics
ISBN:
9781305506381
Author:
James R. McGuigan, R. Charles Moyer, Frederick H.deB. Harris
Publisher:
Cengage Learning


Managerial Economics: Applications, Strategies an…
Economics
ISBN:
9781305506381
Author:
James R. McGuigan, R. Charles Moyer, Frederick H.deB. Harris
Publisher:
Cengage Learning


Economics: Private and Public Choice (MindTap Cou…
Economics
ISBN:
9781305506725
Author:
James D. Gwartney, Richard L. Stroup, Russell S. Sobel, David A. Macpherson
Publisher:
Cengage Learning