Suppose consumers and businesses become more optimistic about future economic conditions, causing the aggregate demand curve to increase by $0.5 trillion at each price level. Use the green line (triangle symbols) to show the new aggregate demand curve (AD2). Be sure that AD2 is parallel to AD1 (you can hover your cursor over AD1 to see its slope). Then use the red drop lines (cross symbol) to indicate the new macroeconomic equilibrium after the shift of aggregate demand.
Suppose consumers and businesses become more optimistic about future economic conditions, causing the aggregate demand curve to increase by $0.5 trillion at each price level. Use the green line (triangle symbols) to show the new aggregate demand curve (AD2). Be sure that AD2 is parallel to AD1 (you can hover your cursor over AD1 to see its slope). Then use the red drop lines (cross symbol) to indicate the new macroeconomic equilibrium after the shift of aggregate demand.

Macroeconomics: Private and Public Choice (MindTap Course List)
16th Edition
ISBN:9781305506756
Author:James D. Gwartney, Richard L. Stroup, Russell S. Sobel, David A. Macpherson
Publisher:James D. Gwartney, Richard L. Stroup, Russell S. Sobel, David A. Macpherson
Chapter9: An Introduction To Basic Macroeconomic Markets
Section: Chapter Questions
Problem 15CQ

Related questions
Question
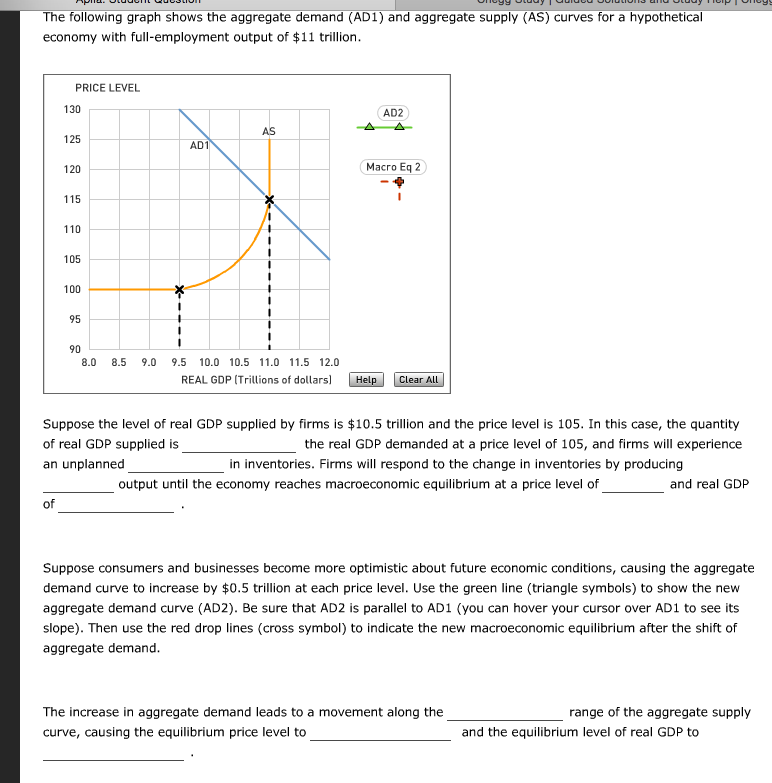
Transcribed Image Text:The following graph shows the aggregate demand (AD1) and aggregate supply (AS) curves for a hypothetical
economy with full-employment output of $11 trillion.
PRICE LEVEL
of
130
125
120
115
110
105
100
95
90
8.0 8.5 9.0
AD1
AS
AD2
Macro Eq 2
9.5 10.0 10.5 11.0 11.5 12.0
REAL GDP (Trillions of dollars) Help
Clear All
Suppose the level of real GDP supplied by firms is $10.5 trillion and the price level is 105. In this case, the quantity
of real GDP supplied is
the real GDP demanded at a price level of 105, and firms will experience
an unplanned
in inventories. Firms will respond to the change in inventories by producing
output until the economy reaches macroeconomic equilibrium at a price level of
and real GDP
Suppose consumers and businesses become more optimistic about future economic conditions, causing the aggregate
demand curve to increase by $0.5 trillion at each price level. Use the green line (triangle symbols) to show the new
aggregate demand curve (AD2). Be sure that AD2 is parallel to AD1 (you can hover your cursor over AD1 to see its
slope). Then use the red drop lines (cross symbol) to indicate the new macroeconomic equilibrium after the shift of
aggregate demand.
The increase in aggregate demand leads to a movement along the
curve, causing the equilibrium price level to
range of the aggregate supply
and the equilibrium level of real GDP to
Expert Solution
This question has been solved!
Explore an expertly crafted, step-by-step solution for a thorough understanding of key concepts.

This is a popular solution!

Trending now
This is a popular solution!

Step by step
Solved in 2 steps with 1 images

Knowledge Booster


Learn more about
Need a deep-dive on the concept behind this application? Look no further. Learn more about this topic, economics and related others by exploring similar questions and additional content below.Recommended textbooks for you
Macroeconomics: Private and Public Choice (MindTa…
Economics
ISBN:
9781305506756
Author:
James D. Gwartney, Richard L. Stroup, Russell S. Sobel, David A. Macpherson
Publisher:
Cengage Learning

Economics: Private and Public Choice (MindTap Cou…
Economics
ISBN:
9781305506725
Author:
James D. Gwartney, Richard L. Stroup, Russell S. Sobel, David A. Macpherson
Publisher:
Cengage Learning

Macroeconomics: Private and Public Choice (MindTa…
Economics
ISBN:
9781305506756
Author:
James D. Gwartney, Richard L. Stroup, Russell S. Sobel, David A. Macpherson
Publisher:
Cengage Learning
Economics: Private and Public Choice (MindTap Cou…
Economics
ISBN:
9781305506725
Author:
James D. Gwartney, Richard L. Stroup, Russell S. Sobel, David A. Macpherson
Publisher:
Cengage Learning


Principles of Economics 2e
Economics
ISBN:
9781947172364
Author:
Steven A. Greenlaw; David Shapiro
Publisher:
OpenStax