Suppose Farmer Smith grows apples. The enitre market for apples is shown in the figure below. Assume the market for apples is perfectly competitive. Price of apples (dollars per basket) SONO O N 22- 20- 18- 16- 14+ 12- 10- 6- Supply 4- 2- 0- Demand 0 2 4 6 8 10 12 14 16 18 20 22 Quantity of apples (baskets per year in billions) Use the line drawing tool to draw the demand curve for farmer Smith's apples. Label this line 'Demand for Smith apples'. Carefully follow the instructions above, and only draw the required objects. Price of apples (dollars per basket) 22- 20- 18+ 16- 14- 2- 0- 0 4 6 8 10 12 14 16 18 20 Quantity of apples (baskets per year in 1000s)
Suppose Farmer Smith grows apples. The enitre market for apples is shown in the figure below. Assume the market for apples is perfectly competitive. Price of apples (dollars per basket) SONO O N 22- 20- 18- 16- 14+ 12- 10- 6- Supply 4- 2- 0- Demand 0 2 4 6 8 10 12 14 16 18 20 22 Quantity of apples (baskets per year in billions) Use the line drawing tool to draw the demand curve for farmer Smith's apples. Label this line 'Demand for Smith apples'. Carefully follow the instructions above, and only draw the required objects. Price of apples (dollars per basket) 22- 20- 18+ 16- 14- 2- 0- 0 4 6 8 10 12 14 16 18 20 Quantity of apples (baskets per year in 1000s)

Microeconomics: Principles & Policy
14th Edition
ISBN:9781337794992
Author:William J. Baumol, Alan S. Blinder, John L. Solow
Publisher:William J. Baumol, Alan S. Blinder, John L. Solow
Chapter15: The Shortcomings Of Free Markets
Section: Chapter Questions
Problem 2TY

Related questions
Question
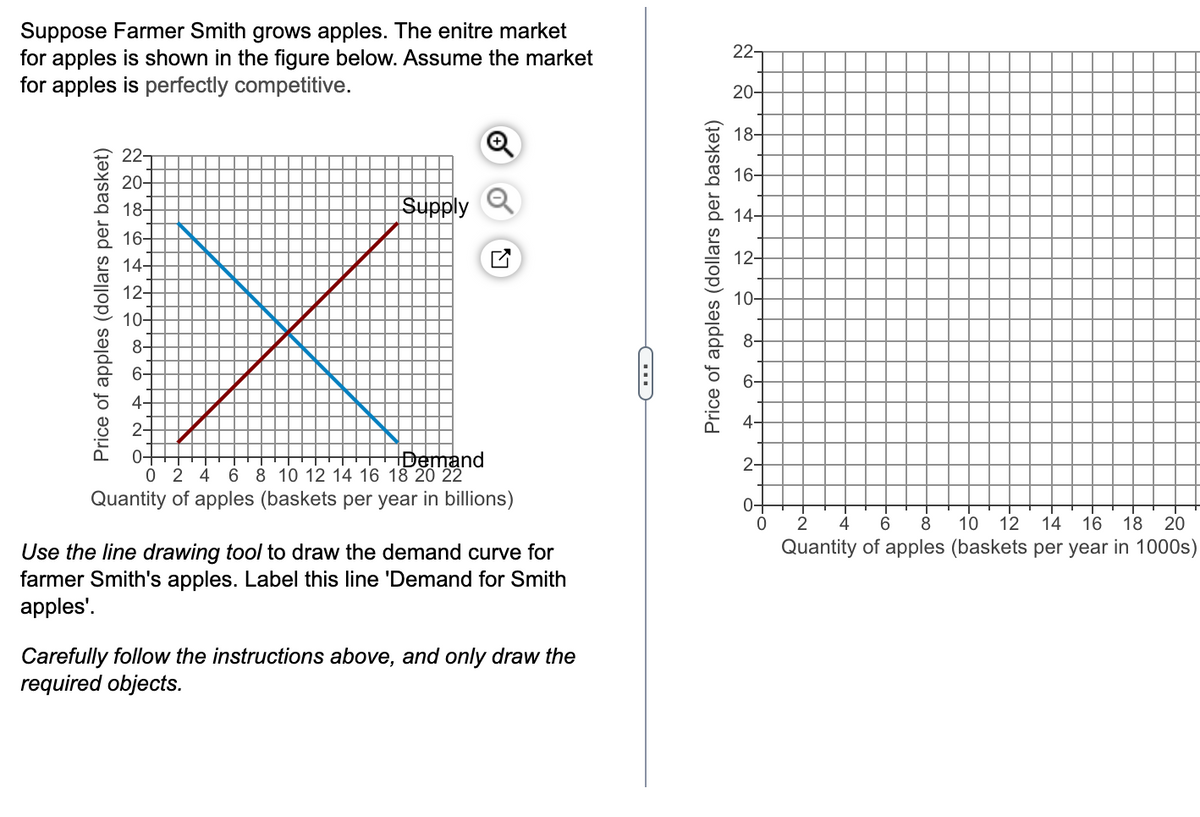
Transcribed Image Text:Suppose Farmer Smith grows apples. The enitre market
for apples is shown in the figure below. Assume the market
for apples is perfectly competitive.
Price of apples (dollars per basket)
22-
20-
18-
16-
14-
12-
10-
8-
6-
4
2-
0-
******
Supply
Demand
24 6 8 10 12 14 16 18 20 22
Quantity of apples (baskets per year in billions)
Use the line drawing tool to draw the demand curve for
farmer Smith's apples. Label this line 'Demand for Smith
apples'.
Carefully follow the instructions above, and only draw the
required objects.
CH
Price of apples (dollars per basket)
22-
20-
18-
16-
14-
2-
0
2
4 6 8 10 12 14 16 18 20
Quantity of apples (baskets per year in 1000s)
Expert Solution
This question has been solved!
Explore an expertly crafted, step-by-step solution for a thorough understanding of key concepts.

This is a popular solution!

Trending now
This is a popular solution!

Step by step
Solved in 3 steps with 1 images

Knowledge Booster


Learn more about
Need a deep-dive on the concept behind this application? Look no further. Learn more about this topic, economics and related others by exploring similar questions and additional content below.Recommended textbooks for you
Microeconomics: Principles & Policy
Economics
ISBN:
9781337794992
Author:
William J. Baumol, Alan S. Blinder, John L. Solow
Publisher:
Cengage Learning

Exploring Economics
Economics
ISBN:
9781544336329
Author:
Robert L. Sexton
Publisher:
SAGE Publications, Inc

Microeconomics: Principles & Policy
Economics
ISBN:
9781337794992
Author:
William J. Baumol, Alan S. Blinder, John L. Solow
Publisher:
Cengage Learning
Exploring Economics
Economics
ISBN:
9781544336329
Author:
Robert L. Sexton
Publisher:
SAGE Publications, Inc


Principles of Economics 2e
Economics
ISBN:
9781947172364
Author:
Steven A. Greenlaw; David Shapiro
Publisher:
OpenStax