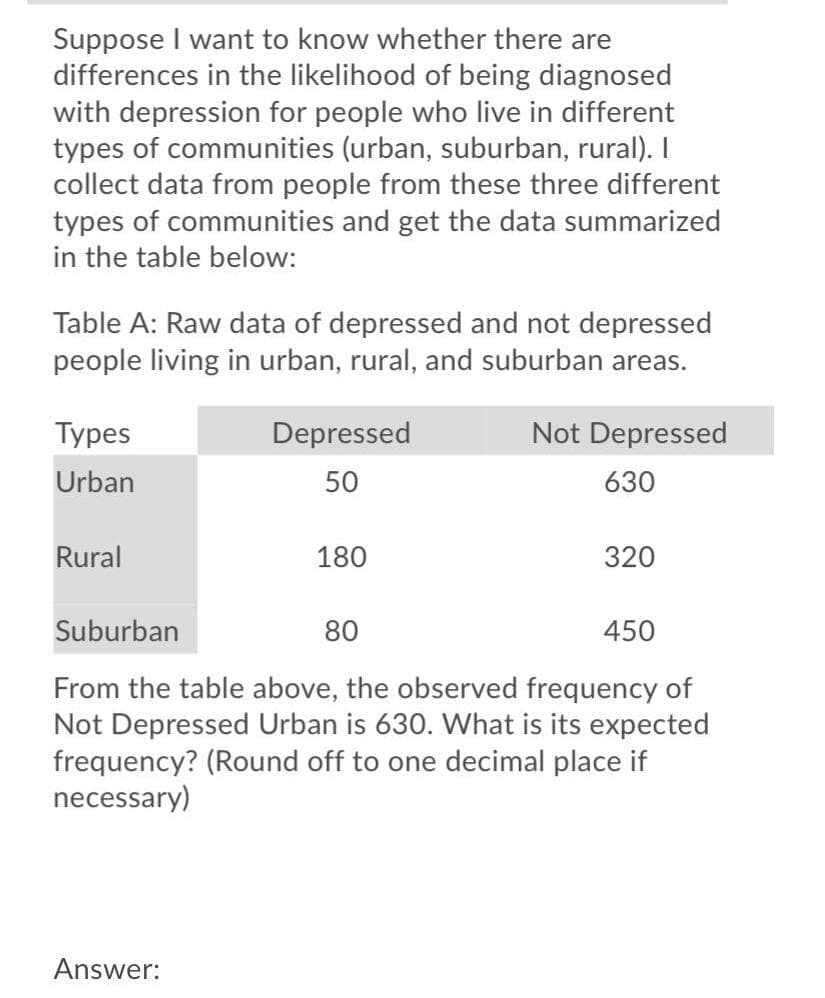
Suppose I want to know whether there are differences in the likelihood of being diagnosed with depression for people who live in different types of communities (urban, suburban, rural). I collect data from people from these three different types of communities and get the data summarized in the table below: Table A: Raw data of depressed and not depressed people living in urban, rural, and suburban areas. Туpes Depressed Not Depressed Urban 50 630 Rural 180 320 Suburban 80 450 From the table above, the observed frequency of Not Depressed Urban is 630. What is its expected frequency? (Round off to one decimal place if necessary)
Suppose I want to know whether there are differences in the likelihood of being diagnosed with depression for people who live in different types of communities (urban, suburban, rural). I collect data from people from these three different types of communities and get the data summarized in the table below: Table A: Raw data of depressed and not depressed people living in urban, rural, and suburban areas. Туpes Depressed Not Depressed Urban 50 630 Rural 180 320 Suburban 80 450 From the table above, the observed frequency of Not Depressed Urban is 630. What is its expected frequency? (Round off to one decimal place if necessary)

Glencoe Algebra 1, Student Edition, 9780079039897, 0079039898, 2018
18th Edition
ISBN:9780079039897
Author:Carter
Publisher:Carter
Chapter10: Statistics
Section10.6: Summarizing Categorical Data
Problem 27PPS

Related questions

Concept explainers
Contingency Table
A contingency table can be defined as the visual representation of the relationship between two or more categorical variables that can be evaluated and registered. It is a categorical version of the scatterplot, which is used to investigate the linear relationship between two variables. A contingency table is indeed a type of frequency distribution table that displays two variables at the same time.
Binomial Distribution
Binomial is an algebraic expression of the sum or the difference of two terms. Before knowing about binomial distribution, we must know about the binomial theorem.
Topic Video
Question
Transcribed Image Text:Suppose I want to know whether there are
differences in the likelihood of being diagnosed
with depression for people who live in different
types of communities (urban, suburban, rural). I
collect data from people from these three different
types of communities and get the data summarized
in the table below:
Table A: Raw data of depressed and not depressed
people living in urban, rural, and suburban areas.
Туpes
Depressed
Not Depressed
Urban
50
630
Rural
180
320
Suburban
80
450
From the table above, the observed frequency of
Not Depressed Urban is 630. What is its expected
frequency? (Round off to one decimal place if
necessary)
Answer:
Expert Solution
This question has been solved!
Explore an expertly crafted, step-by-step solution for a thorough understanding of key concepts.

This is a popular solution!

Trending now
This is a popular solution!

Step by step
Solved in 2 steps with 3 images

Knowledge Booster


Learn more about
Need a deep-dive on the concept behind this application? Look no further. Learn more about this topic, statistics and related others by exploring similar questions and additional content below.Recommended textbooks for you
Glencoe Algebra 1, Student Edition, 9780079039897…
Algebra
ISBN:
9780079039897
Author:
Carter
Publisher:
McGraw Hill

Holt Mcdougal Larson Pre-algebra: Student Edition…
Algebra
ISBN:
9780547587776
Author:
HOLT MCDOUGAL
Publisher:
HOLT MCDOUGAL
Glencoe Algebra 1, Student Edition, 9780079039897…
Algebra
ISBN:
9780079039897
Author:
Carter
Publisher:
McGraw Hill
Holt Mcdougal Larson Pre-algebra: Student Edition…
Algebra
ISBN:
9780547587776
Author:
HOLT MCDOUGAL
Publisher:
HOLT MCDOUGAL