, It has been hypothesised that the probability of having an asthma attack on a particular day may vary across the days of the week. Baibergenov et al. (2005) report a longitudinal study in which the number of emergency department admissions due to asthma were recorded in Ontario between April 2001 and March 2004. Suppose the data were as in the table below: Day of attack Number recorded 15456 13811 13228 12786 12446 14228 16837 Mon Tues wed Thur Fri Sat Sun Baibergenova, A., Thabane, L., Akhtar-Danesh, N., Levine, M., Gafni, A., Moineddin, R. and Pulcins, I. (2005): Effect of gender, age, and severity of asthma attack on patterns of emergency department visits due to asthma by month and day of the week. European Journal of Epidemiology 20, No.11, 947-956. Part a) Which graphical method would best display the above data? O A. A bar chart OB. A histogram OC.A stem-and-leaf plot OD. A pie chart OE. A boxplot
, It has been hypothesised that the probability of having an asthma attack on a particular day may vary across the days of the week. Baibergenov et al. (2005) report a longitudinal study in which the number of emergency department admissions due to asthma were recorded in Ontario between April 2001 and March 2004. Suppose the data were as in the table below: Day of attack Number recorded 15456 13811 13228 12786 12446 14228 16837 Mon Tues wed Thur Fri Sat Sun Baibergenova, A., Thabane, L., Akhtar-Danesh, N., Levine, M., Gafni, A., Moineddin, R. and Pulcins, I. (2005): Effect of gender, age, and severity of asthma attack on patterns of emergency department visits due to asthma by month and day of the week. European Journal of Epidemiology 20, No.11, 947-956. Part a) Which graphical method would best display the above data? O A. A bar chart OB. A histogram OC.A stem-and-leaf plot OD. A pie chart OE. A boxplot

Holt Mcdougal Larson Pre-algebra: Student Edition 2012
1st Edition
ISBN:9780547587776
Author:HOLT MCDOUGAL
Publisher:HOLT MCDOUGAL
Chapter11: Data Analysis And Probability
Section: Chapter Questions
Problem 8CR

Related questions
Question
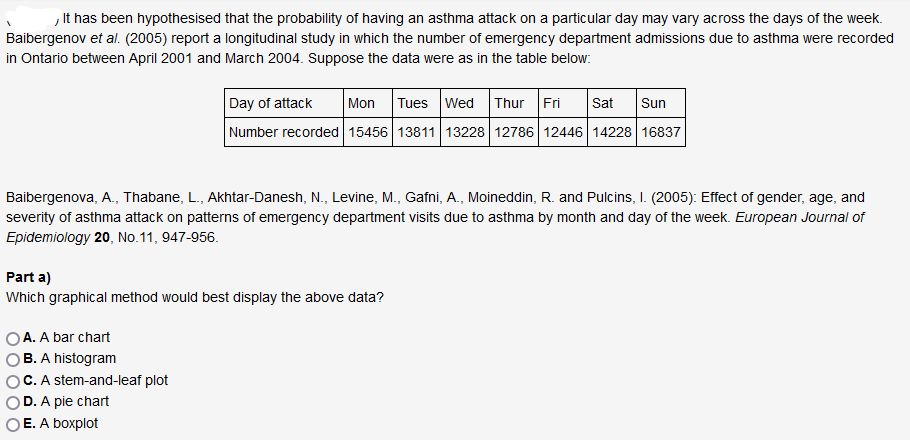
Transcribed Image Text:, It has been hypothesised that the probability of having an asthma attack on a particular day may vary across the days of the week.
Baibergenov et al. (2005) report a longitudinal study in which the number of emergency department admissions due to asthma were recorded
in Ontario between April 2001 and March 2004. Suppose the data were as in the table below:
Day of attack
Tues Wed Thur Fri
Sun
Mon
Sat
Number recorded 15456 13811 13228 12786 12446 14228 16837
Baibergenova, A., Thabane, L., Akhtar-Danesh, N., Levine, M., Gafni, A., Moineddin, R. and Pulcins, I. (2005): Effect of gender, age, and
severity of asthma attack on patterns of emergency department visits due to asthma by month and day of the week. European Journal of
Epidemiology 20, No.11, 947-956.
Part a)
Which graphical method would best display the above data?
A. A bar chart
B. A histogram
C. A stem-and-leaf plot
D. A pie chart
E. A boxplot
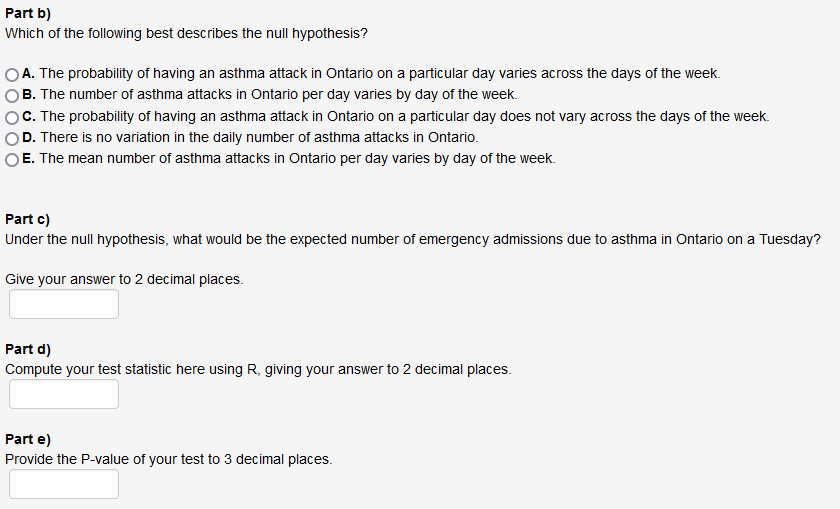
Transcribed Image Text:Part b)
Which of the following best describes the null hypothesis?
A. The probability of having an asthma attack in Ontario on a particular day varies across the days of the week.
B. The number of asthma attacks in Ontario per day varies by day of the week.
C. The probability of having an asthma attack in Ontario on a particular day does not vary across the days of the week.
D. There is no variation in the daily number of asthma attacks in Ontario.
E. The mean number of asthma attacks in Ontario per day varies by day of the week.
Part c)
Under the null hypothesis, what would be the expected number of emergency admissions due to asthma in Ontario on a Tuesday?
Give your answer to 2 decimal places.
Part d)
Compute your test statistic here using R, giving your answer to 2 decimal places.
Part e)
Provide the P-value of your test to 3 decimal places.
Expert Solution
This question has been solved!
Explore an expertly crafted, step-by-step solution for a thorough understanding of key concepts.

This is a popular solution!

Trending now
This is a popular solution!

Step by step
Solved in 4 steps

Recommended textbooks for you
Holt Mcdougal Larson Pre-algebra: Student Edition…
Algebra
ISBN:
9780547587776
Author:
HOLT MCDOUGAL
Publisher:
HOLT MCDOUGAL

Holt Mcdougal Larson Pre-algebra: Student Edition…
Algebra
ISBN:
9780547587776
Author:
HOLT MCDOUGAL
Publisher:
HOLT MCDOUGAL