Suppose IQ scores were obtained for 20 randomly selected sets of couples. The 20 pairs of measurements yield x= 101.16, y= 102.3, r 0.810, P-value 0.000, and y = 23.09 + 0.78x, where x represents the IQ score of the wife, Find the best predicted value of y given that the wife has an IQ of 109? Use a significance level of 0.05. Click the icon to view the critical values of the Pearson correlation coefficient r. c...... The best predicted value of y is. (Round to two decimal places as needed.) Critical values of the pearson correlation coefficient r NOTE: To test Ho p=0 against H,: p#0, reject H, if the absolute value of r is greater than the critical value in the table. a= 0.05 a= 0.01 4 0.990 0.959 0.950 5 0.878 6. 0.811 0.917 0.754 0.707 0.875 8 0.834 9 0.666 0.798 10 0.632 0.765 11 0.602 0.735 12 0.576 0.708 0.553 0.532 0.514 13 0.684 14 0.661 15 16 0.641 0.623 0.497 0.482 17 18 19 0.606 0.468 0.590 0.456 0.575 20 0.444 0.561 25 0.396 0.505 30 0.361 0.463 35 0.335 0.430 40 45 50 0.312 0.294 0.279 0.254 0.402 0.378 0.361 60 0.330 0.305 0.286 70 0.236 0.220 0.207 0.196 80 90 0.269 100 0.256 a = 0.05 a = 0.01 in Statcrunch
Suppose IQ scores were obtained for 20 randomly selected sets of couples. The 20 pairs of measurements yield x= 101.16, y= 102.3, r 0.810, P-value 0.000, and y = 23.09 + 0.78x, where x represents the IQ score of the wife, Find the best predicted value of y given that the wife has an IQ of 109? Use a significance level of 0.05. Click the icon to view the critical values of the Pearson correlation coefficient r. c...... The best predicted value of y is. (Round to two decimal places as needed.) Critical values of the pearson correlation coefficient r NOTE: To test Ho p=0 against H,: p#0, reject H, if the absolute value of r is greater than the critical value in the table. a= 0.05 a= 0.01 4 0.990 0.959 0.950 5 0.878 6. 0.811 0.917 0.754 0.707 0.875 8 0.834 9 0.666 0.798 10 0.632 0.765 11 0.602 0.735 12 0.576 0.708 0.553 0.532 0.514 13 0.684 14 0.661 15 16 0.641 0.623 0.497 0.482 17 18 19 0.606 0.468 0.590 0.456 0.575 20 0.444 0.561 25 0.396 0.505 30 0.361 0.463 35 0.335 0.430 40 45 50 0.312 0.294 0.279 0.254 0.402 0.378 0.361 60 0.330 0.305 0.286 70 0.236 0.220 0.207 0.196 80 90 0.269 100 0.256 a = 0.05 a = 0.01 in Statcrunch

Glencoe Algebra 1, Student Edition, 9780079039897, 0079039898, 2018
18th Edition
ISBN:9780079039897
Author:Carter
Publisher:Carter
Chapter10: Statistics
Section10.3: Measures Of Spread
Problem 1GP

Related questions
Question
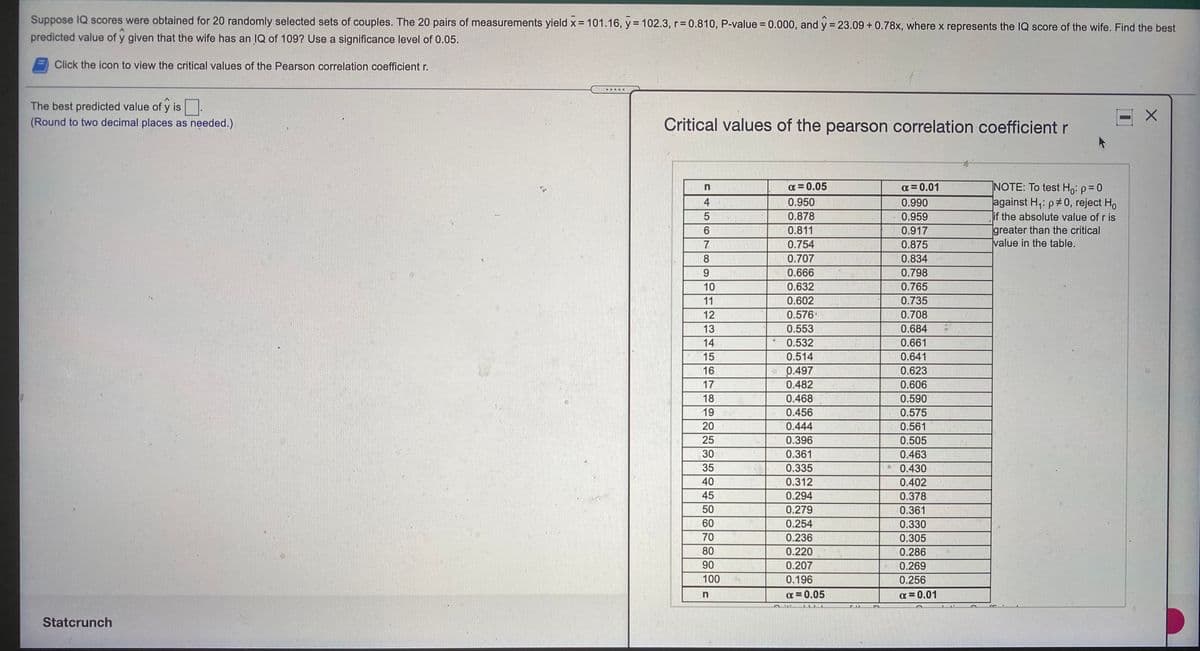
Transcribed Image Text:Suppose IQ scores were obtained for 20 randomly selected sets of couples. The 20 pairs of measurements yield x = 101.16, y = 102.3, r= 0.810, P-value = 0.000, and y = 23.09+0.78x, where x represents the IQ score of the wife. Find the best
%3D
%3D
%3D
predicted value of y given that the wife has an IQ of 109? Use a significance level of 0.05.
Click the icon to view the critical values of the Pearson correlation coefficient r.
....
The best predicted value of y is .
(Round to two decimal places as needed.)
Critical values of the pearson correlation coefficient r
NOTE: To test Ho: p = 0
against H,: p#0, reject Ho
|if the absolute value of r is
greater than the critical
value in the table.
a = 0.05
a = 0.01
4
0.950
0.990
0.878
0.959
0.811
0.917
0.754
0.875
0.707
0.834
0.666
0.798
10
0.632
0.765
11
0.602
0.735
12
0.576
0.708
13
0.553
0.684
14
0.532
0.661
15
0.514
0.641
16
0.497
0.623
17
0.482
0.606
18
0.468
0.590
19
0.456
0.575
20
0.444
0.561
25
0.396
0.505
30
0.361
0.463
35
0.335
0.430
40
0.312
0.402
45
0.294
0.378
50
0.279
0.361
60
0.254
0.330
70
0.236
0.305
80
0.220
0.286
90
0.207
0.269
100
0.196
0.256
in
a = 0.05
a = 0.01
Statcrunch
Expert Solution
This question has been solved!
Explore an expertly crafted, step-by-step solution for a thorough understanding of key concepts.

Step by step
Solved in 2 steps with 1 images

Recommended textbooks for you
Glencoe Algebra 1, Student Edition, 9780079039897…
Algebra
ISBN:
9780079039897
Author:
Carter
Publisher:
McGraw Hill
Glencoe Algebra 1, Student Edition, 9780079039897…
Algebra
ISBN:
9780079039897
Author:
Carter
Publisher:
McGraw Hill