Suppose IQ scores were obtained for 20 randomly selected sets of couples. The 20 pairs of measurements yield x= 98.14, y = 98.05, r=0.819, P-value = 0.000, and y = 16.2 + 0.83x, where x represents the IQ score of the wife. Find the best predicted value of y given that the wife has an IQ of 97? Use a significance level of 0.05. E Click the icon to view the critical values of the Pearson correlation coefficient r. The best predicted value of y isn. (Round to two decimal places as needed.)
Suppose IQ scores were obtained for 20 randomly selected sets of couples. The 20 pairs of measurements yield x= 98.14, y = 98.05, r=0.819, P-value = 0.000, and y = 16.2 + 0.83x, where x represents the IQ score of the wife. Find the best predicted value of y given that the wife has an IQ of 97? Use a significance level of 0.05. E Click the icon to view the critical values of the Pearson correlation coefficient r. The best predicted value of y isn. (Round to two decimal places as needed.)

Algebra & Trigonometry with Analytic Geometry
13th Edition
ISBN:9781133382119
Author:Swokowski
Publisher:Swokowski
Chapter5: Inverse, Exponential, And Logarithmic Functions
Section: Chapter Questions
Problem 12DE

Related questions
Question
4q
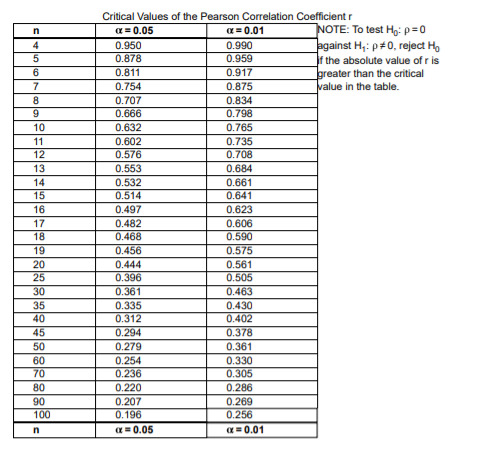
Transcribed Image Text:Critical Values of the Pearson Correlation Coefficient r
NOTE: To test Ho: p=0
pgainst H,: p#0, reject H,
f the absolute value of r is
greater than the critical
value in the table.
a = 0.05
(= 0.01
4
0.950
0.990
0.959
5
0.878
6
0.811
0.917
7
0.754
0.875
0.707
0.834
9
0.666
0.798
10
0.632
0.765
11
0.602
0.735
12
0.576
0.708
13
0.553
0.684
14
0.532
0.514
0.661
15
0.641
16
0.497
0.623
17
0.482
0.468
0.606
18
0.590
19
0.456
0.575
20
0.444
0.396
0.561
0.505
25
30
0.361
0.463
35
40
0.335
0.430
0.402
0.312
45
0.294
0.378
50
0.279
0.361
60
70
0.254
0.236
0.330
0.305
80
0.220
0.286
0.269
90
100
0.207
0.196
0.256
a= 0.05
x= 0.01
n
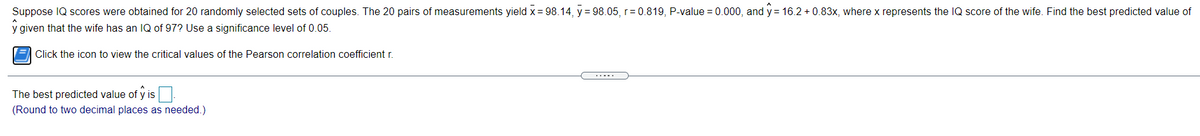
Transcribed Image Text:Suppose IQ scores were obtained for 20 randomly selected sets of couples. The 20 pairs of measurements yield x = 98.14, y = 98.05, r= 0.819, P-value = 0.000, and y = 16.2 + 0.83x, where x represents the IQ score of the wife. Find the best predicted value of
y given that the wife has an IQ of 97? Use a significance level of 0.05.
E Click the icon to view the critical values of the Pearson correlation coefficient r.
.....
The best predicted value of y is
(Round to two decimal places as needed.)
Expert Solution
This question has been solved!
Explore an expertly crafted, step-by-step solution for a thorough understanding of key concepts.

Step by step
Solved in 2 steps

Recommended textbooks for you
Algebra & Trigonometry with Analytic Geometry
Algebra
ISBN:
9781133382119
Author:
Swokowski
Publisher:
Cengage

Functions and Change: A Modeling Approach to Coll…
Algebra
ISBN:
9781337111348
Author:
Bruce Crauder, Benny Evans, Alan Noell
Publisher:
Cengage Learning
Algebra & Trigonometry with Analytic Geometry
Algebra
ISBN:
9781133382119
Author:
Swokowski
Publisher:
Cengage
Functions and Change: A Modeling Approach to Coll…
Algebra
ISBN:
9781337111348
Author:
Bruce Crauder, Benny Evans, Alan Noell
Publisher:
Cengage Learning