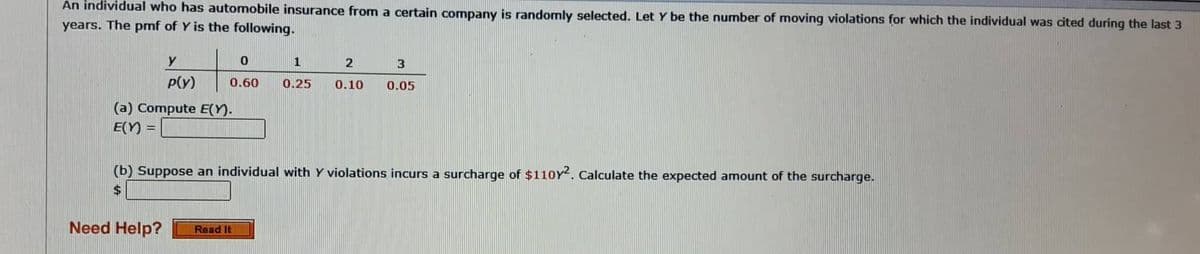
(a) Compute E(Y). E(Y) = (b) Suppose an individual with Y violations incurs a surcharge of $110Y2. Calculate the expected amount of the surcharge.


Q: Listed below are the amounts (dollars) it costs for marriage proposal packages at different baseball…
A:
Q: The number of people who visited the local swimming pool on several days in July were recorded. Does…
A: Here, we can see in the figure, temperature and number of people both are in positive trend.
Q: H3. In a given city it rains 25% of the days. A meteorologist has an 80% chance of getting his…
A: Given that, city it rains 25% of the days. A meteorologist has an 80% chance of getting his forecast…
Q: The ACF of the residual u can be used to check the adequacy of the fitted AR(1) model which has the…
A: The given AR(1) model is: yt=2+0.7yt-1+ut The AR model of order 1 is interpreted as the model in…
Q: A new industrial oven has just been installed at Piatt Bakery. To develop experience regarding the…
A: Given data: TIME 1 2 3 4 8:00 am 50 47 49 53 8:30 am 51 55 55 44 9:00 am 53 48 33 64 9:30…
Q: State whether the data described below are discrete or continuous, and explain why. The land areas…
A:
Q: Day Monday Tuesday Wednesday Users Table 10: Daily website Traffic Overview 116 112 556 95 New users…
A: Day Users New Users No of sessions per user total page views Average session duration Monday 116…
Q: After analysing months of sales data, the owner of an appliance store produced the following joint…
A: Given data: Computers Printers 0 1 2 0 0.08 0.14 0.12 1 0.09 0.17 0.13 2 0.05 0.18 0.04…
Q: Suppose x has a distribution with a mean of 30 and a standard deviation of 4. Random samples of size…
A: a) Consider a random variable x.
Q: Use the data below to solve for the following: 2. Naïve method 3. Unweighted 3 month moving average…
A: 5) The information is given as follows: Ft+1=32α=0.2 Suppose t=0, then F1 (Initial Forecast)=32. The…
Q: b. A best-fit line has been included on the calibration curve via a least squares analysis. By…
A: For the plotted scatter graph, which considers the "Concentration value (in uM)" and "Detector…
Q: suppose we select one card from a standard deck of 52. what is the probability of selecting a club?
A: given data select one card from a standard deck of 52 cards. p(selecting club) = ?
Q: What type of variable is highest education degree completed
A: Variables are of two types, they are qualitative and quantitative. Qualitative is also known as…
Q: Consider the following data find the value of P(X>-4). Round your answer to one decimal place.
A: Given: X -5 - 4 -3 - 2 - 1 P(x) 0.2 0.3 0.2 0.1 0.2
Q: A man just bought 6 suits, 11 shirts, and 15 ties. All of these suits, shirts, and ties coordinate…
A: Theory of Combination:
Q: my, with calls for the bank to slash lending rates and finance government through quantitative…
A: SARB - South African Reserve bank 1 Risk Policy mistakes 2 Credibility 3 slash lending rates…
Q: Alex only eats dinner at Henry's Tavern or Felicity's. However, he refuses to eat at Felicity's two…
A: From the given statement, it is to be noted that the chances of eat at Felicity's two days in a row…
Q: Consider the following data find the value of P(X_>-2).Round your answer to one decimal place
A: Given that x -5 -4 -3 -2 -1 P(X = x ) 0.2 0.3 0.2 0.1 0.2
Q: Want to explain these outputs?
A: Normality of the test is used to determine the population follow normal distribution or not. It can…
Q: Suppose that a histogram is constructed for the frequency distribution shown below.
A: Histogram is used to measure the spread of the data set. It used to visualize the continuous data…
Q: X a = y 1 2 828 1117 3 4 5 6 1584 2337 3249 4429 Use regression to find an exponential equation that…
A: Given data: x y 1 828 2 1117 3 1584 4 2337 5 3249 6 4429 The exponential equation…
Q: Let X> 0 and X, X₁, X2,... be random variables with X~ Poisson(A) and X₁ ~ Binom(n,A). Prove that…
A: Hint: Find mgf of X and Xn if they came as unique, they by uniqueness theorem of moment generating…
Q: Table 3.1 lists the total sales (rounded to billions of dollars) of six U.S. companies for 2008.…
A: For the given data of sales in 2008 for 6 companies, We have to calculate mean. Here N=6
Q: Scores 51-58 59-66 67-74 Class Mark, A 54.5 62.5 70.5 Frequency, 3 7 15
A: The given data is; Scores Class Mark, x Frequency, f 51-58 54.5 3 59-66 62.5 7 67-74 70.5…
Q: A cocoa packaging machine fills bags so that the bag contents have a standard deviation of 3.5g.…
A: A random sample of 20 bags with mean 102.0g n=20x=102.0 Population standard deviation is 3.5g…
Q: This is denoted as Ho and is a tentative assumption about a population parameter.
A: The given statement is 'a tentative assumption about a population parameter'.
Q: For each research project listed here, identify the var- iables and classify them in terms of level…
A: Since you have posted a question with multiple sub-parts, we will solve first three subparts for…
Q: O % Increase % Increase 4221 SL86 40-49.9 50-59.9 60-69.9 70-79.9 80-89.9 90-99.9 100-109.9…
A: The given data for the percentage increase is: For obtaining the appropriate frequency histogram,…
Q: 15) The heights of basketball players at a certain high school are normally distributed with a mean…
A: given data normal distribution μ=193.25σ=6.52P(X<210)=?
Q: In a given city it rains 25% of the days. A meteorologist has an 80% chance of getting his forecast…
A: Given: Prainy day=25%=0.25 Psunny day=1-0.25=0.75 Pcorrect forecast | sunny day=0.80 Pcorrect…
Q: Want to explain these outputs?
A: Assumption of normality can be tested using normality test. It can be tested using the various…
Q: " Table 10 provides the daily website traffic overview for the last week. The webmaster would like…
A: Day Users New Users No of sessions per user total page views Average session duration Monday 116…
Q: In the semi-conductor manufacturing plant example, compute for the predicted value (ŷ) of…
A:
Q: sample of 30 employees from large companies was selected, and these employees were ed how stressful…
A:
Q: Identify the level of measurement of the data, and explain what is wrong with the given calculation.…
A: We have given that In a set of data, mood levels are represented as 100 for bad, 200 for OK, and 300…
Q: The table below shows the frequency distribution of the rainfall on 52 consecutive Mondays in a…
A: class frequency 0.00-0.19 23 0.20-0.39 11 0.40-0.59 6 0.60-0.79 2 0.80-0.99 6…
Q: How many different outcomes are possible for 13 tosses of a coin?
A: Given that How many different outcomes are possible for 13 tosses of a coin
Q: 5. If a = 0.1 and b=1.0, how many steps of the bisection method are needed to determine the root…
A: Value of a=0.1 b=1.0 Error =0.5*10^(-8) We have to calculate Steps for bisection method
Q: The last digit of the heights of 42 statistics students were obtained as part of an experiment…
A: The question is about graphical representation of data Given : To find : To draw a histogram and…
Q: 5. Simple Exponential Smoothing with the following parameters: Ft+1=32 and the a = .15 6. Time…
A: Time series are used to forecast the variable based on the time. There are four components in the…
Q: Want to explain these outputs?
A: Anova is the measure of mean significance. It compare three or more groups. It explain the variation…
Q: The Highway Patrol, using radar, checked the speeds (in mph) of 30 passing motorists at a…
A: Given: Number of observation = 30 Number of classes n = 6 Formula Used: Class width = Rangen Range =…
Q: Want to explain these outputs?
A: ANOVA is the measure of mean significant between groups. If it has one categorical variable with…
Q: 5. The following data are direct solar (watts/m2) at intensity measurements a location in southern…
A: The question is about grouped frequency distribution Given : Starting first class interval = 450 -…
Q: 13) Find the mean, median, mode, and range for the following data: Traffic Violations 1 2 3 4 56…
A: The question is about frequency distribution Given : To find : 1 ) Mean 2 ) Median 3 ) Mode 4 )…
Q: In a computer game, different units are created randomly with different levels of range and…
A: The data shows the different levels of range and Aggression.
Q: Let t be the number of years since 1989. What does t=6 mean in this situation
A: In this case, t represents the number of years since 1989.
Q: am interested in the difference between a learners academic achievement and whether he/she takes…
A: Treatment x Treatment y 1 85 86 2 86 67 3 88 65 4 82 68 5 88 68 6 90 79 7 92 79 8…
Q: 0 3 2 1 0- 4 3 201 1 3 2 5 5 5 6 6
A: Graph number 1 is not the right graph to represent the frequency data as using it we cannot give any…
Q: Let a population consist of the values 10 cigarettes, 11 cigarettes, and 20 cigarettes smoked in a…
A: Given Information: The population consists of values: 10, 11, 20 All possible samples of size 2 with…


Trending now
This is a popular solution!

Step by step
Solved in 2 steps

- Repeat Example 5 when microphone A receives the sound 4 seconds before microphone B.The analysis of tooth shrinkage by C. Loring Brace and colleagues at the University of Michigan’s Museum of Anthropology indicates that human tooth size is con-tinuing to decrease and that the evolutionary process has not yet come to a halt. In northern Europeans, for example, tooth size reduction now has a rate of 1% per 1000 years. a. If t represents time in years and y represents tooth size, use the condition that y = 0.99y0 when t = 1000 to find the value of k in the equation y = y0 ekt. Then use this value of k to answer the following questions. b. In about how many years will human teeth be 90% of their present size? c. What will be our descendants’ tooth size 20,000 years from now (as a percentage of our present tooth size)?The analysis of tooth shrinkage byC. Loring Brace and colleagues at the University of Michigan’s Museum of Anthropology indicates that human tooth size is continuing to decrease and that the evolutionary process has not yetcome to a halt. In northern Europeans, for example, tooth sizereduction now has a rate of 1% per 1000 years.a. If t represents time in years and y represents tooth size, usethe condition that y = 0.99y0 when t = 1000 to find thevalue of k in the equation y = y0ekt. Then use this value of kto answer the following questions.b. In about how many years will human teeth be 90% of theirpresent size?c. What will be our descendants’ tooth size 20,000 years fromnow (as a percentage of our present tooth size)?
- The population, P, of the city of Hazelton has grown according to the mathematical model P = 65,000(1.075)*, where t is the number of years since 2005. a) At what percentage is the population growing? b) If this trend continues, during which year will the population reach approx. 100,000?The best fit line for a time series, {yt : t = 1,2,...,518} is found to be f (t) = 3.4025t + 199.3715. Based on the best fit line, what is the forecast value, when t = 518?ch 11. 4 Oxnard Petro, Ltd., has three interdisciplinary project development teams that function on an ongoing basis. Team members rotate from time to time. Every 4 months (three times a year) each department head rates the performance of each project team (using a 0 to 100 scale, where 100 is the best rating). Are the main effects significant? Is there an interaction?
- Resistors labeled as 100 Ω are purchased from two different vendors. The specification for this type of resistor is that its actual resistance be within 5% of its labeled resistance. In a sample of 180 resistors from vendor A, 150 of them met the specification. In a sample of 270 resistors purchased from vendor B, 233 of them met the specification. Vendor A is the current supplier, but if the data demonstrate convincingly that a greater proportion of the resistors from vendor B meet the specification, a change will be made. a) State the appropriate null and alternate hypotheses. b) Find the P-value. c) Should a change be made?The sales manager of a company has budgeted K120, 000 for an advertising programme for one of the firm’s product. The selected advertising programme consists of running advertisements in two different magazines. The advertisement for magazine 1 costs K2000 per run while the advertisement for magazine 2 costs K.5000 per run. Past experience has indicated that at least 20 runs in magazine 1, and at least 10 runs in magazine 2 are necessary to penetrate the market with any appreciable effect. Also, experience has indicated that there is no reason to make more than 50 runs in either of the two magazines. How many runs in magazine 1 and how many in magazine 2 should be made? Use simplex method.If X1, X2, ... , Xn constitute a random sample of size n from an exponential population, show that X is a consis-tent estimator of the parameter θ.
- Resistors labeled as 100 Ω are purchased from two different vendors. The specification for this type of resistor is that its actual resistance be within 5% of its labeled resistance. In a sample of 180 resistors from vendor A, 149 of them met the specification. In a sample of 270 resistors purchased from vendor B, 233 of them met the specification. Vendor A is the current supplier, but if the data demonstrate convincingly that a greater proportion of the resistors from vendor B meet the specification, a change will be made. P-value?A researcher hypothesizes that in a certain country the net annual growth of private sector purchases of government bonds, B, is positively related to the nominal rate of interest on the bonds, NI, and negatively related to the rate of inflation Π: Bt = a0 + a1NIt + a2Π t + ut Note that it may be hypothesized that B depends on the real rate of interest on bonds, R, where R = NI – Π. Using a sample of 56 annual observations, s/he estimates the following equations: (1) Bt = 0.43 + 0.90NIt - 0.97Πt R21 = 0.962, SSR1 = 2.20, QRESET(F1,52) = 16.6 (3.58) (8.80) (-1.05) (2) Bt = 0.44 + 0.94Rt R22 = 0.960, SSR2 = 2.22, QRESET(F1,53) = 0.9 (9.70) (16.7) (3) Bt = 0.44 + 1.14NIt SSR3 = 9.20, QRESET(F1,53) = 59.9 (8.84) (36.1) (4) NIt = 0.08 + 0.94Πt R24 = 0.997, SSR4 = 0.18, QRESET(F1,53) = 1.4…A manufacturer of extruded plastic products finds that its average daily inventory is 1,250 pieces. A new marketing policy comes into effect and it is desirable to test H0: the average daily inventory is still the same, indicates which alternative hypothesis should be used if: a. You want to know whether or not the new policy changes the average daily inventory.b. It is desirable to demonstrate that the new policy actually reduces the average daily inventory.c. The new policy should be retained as long as it cannot be shown that it actually increases daily inventory.
