Suppose known that the number of goods demanded and offered at two different price levels iS as shown in the following table: Amount Requested (Unit) Price (IDR) 2400 2000 Amount Offered (Unit) 120 180 160 150 Based on the data in the table above, determine the demand function (Qd) and the supply function (Qs) of the goods "X", and determine the market equilibrium point and draw a graph of the market balance!
Suppose known that the number of goods demanded and offered at two different price levels iS as shown in the following table: Amount Requested (Unit) Price (IDR) 2400 2000 Amount Offered (Unit) 120 180 160 150 Based on the data in the table above, determine the demand function (Qd) and the supply function (Qs) of the goods "X", and determine the market equilibrium point and draw a graph of the market balance!

Chapter5: Income And Substitution Effects
Section: Chapter Questions
Problem 5.13P

Related questions
Question
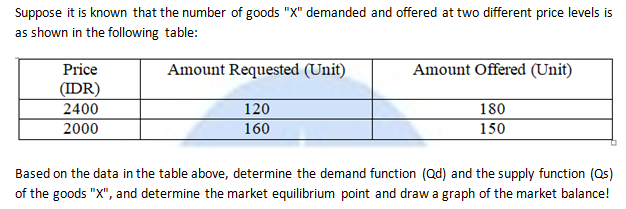
Transcribed Image Text:Suppose it is known that the number of goods "X" demanded and offered at two different price levels is
as shown in the following table:
Price
Amount Requested (Unit)
Amount Offered (Unit)
(IDR)
120
160
180
150
2400
2000
Based on the data in the table above, determine the demand function (Qd) and the supply function (Qs)
of the goods "X", and determine the market equilibrium point and draw a graph of the market balance!
Expert Solution
This question has been solved!
Explore an expertly crafted, step-by-step solution for a thorough understanding of key concepts.

This is a popular solution!

Trending now
This is a popular solution!

Step by step
Solved in 3 steps with 1 images

Knowledge Booster


Learn more about
Need a deep-dive on the concept behind this application? Look no further. Learn more about this topic, economics and related others by exploring similar questions and additional content below.Recommended textbooks for you


Managerial Economics: Applications, Strategies an…
Economics
ISBN:
9781305506381
Author:
James R. McGuigan, R. Charles Moyer, Frederick H.deB. Harris
Publisher:
Cengage Learning
Managerial Economics: Applications, Strategies an…
Economics
ISBN:
9781305506381
Author:
James R. McGuigan, R. Charles Moyer, Frederick H.deB. Harris
Publisher:
Cengage Learning