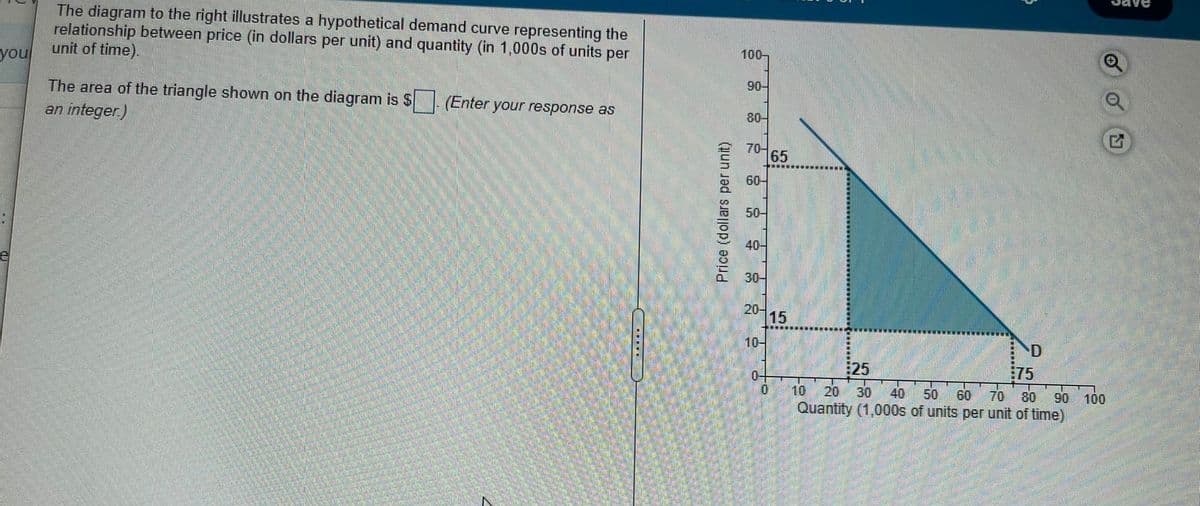
The diagram to the right illustrates a hypothetical demand curve representing the relationship between price (in dollars per unit) and quantity (in 1,000s of units per unit of time). 100- The area of the triangle shown on the diagram is $ (Enter your response as an integer.) 90- 80- 70- 165 60- 50- 40- 20- 15 10- 25 75 0- 10 20 30 40 50 60 70 80 90 100 Quantity (1,000s of units per unit of time) Price (dollars per unit)
Q: The accompanying graph represents a demand curve for a bucket of golf balls at the local driving…
A: When the price decrease, then the quantity demanded increase. And there will be downward movement…
Q: What happens to a given demand curve if one of the determinants of demand change? Provide an example…
A: The determinants of demand are as follows : 1) Price of the good or service : If the price of the…
Q: 21 Correctly label the x-axis and y-axis with the terms price and quantity. 22. Assign values for…
A: Supply curve: Supply curve is upward rising , because with increment in price there will be increase…
Q: demand
A: The law of supply states, ceteris paribus (keeping other things constant) when the price increases ,…
Q: Suppose you have the information shown in the table below about the quantity of a good that is…
A: Consumer surplus= 12×(maximum price-actual price)×Quantity Producer surplus=12×(actual price-minimum…
Q: The price of a widget decreases from $1 to $0.60, and in response to the price change the quantity…
A: The demand for the goods comes from the consumers, individuals, households, and other entities in…
Q: Assume that demand for a commodity is represented by the equation P = 10 − .2Qd and…
A: The equilibrium in a market is achieved where the quantity demanded is equal to the quantity…
Q: If consumers often purchase muffins to eat while they drink their lattes at local coffee shops, what…
A: GENERAL DETERMINANTS OF DEMAND• Good’s own price (P) is the key determinant of demand• Other…
Q: When economists say the demand for a product has increased, they mean the demand curve has shifted…
A: Demand refers to the ability and choice of a consumer to buy a particular good.
Q: DEMAND IN-CLASS WORKSHEET 3 This question examines the market for apples. You will identify a demand…
A: Introduction Here we will examines the market of apples when we have given a demand function and…
Q: Graphically show how the demand curve will shift in the following cases (complements and…
A: Since you have posted a question with multiple sub-parts, we will solve the first three sub parts…
Q: Which of the following statement best describes the law of demand? There is no relationship between…
A: The law of demand shows the negative relationship between the price of a good/service and its price.…
Q: The price of insulin injection kits, used by diabetic patients, increases from $45 to $52, but the…
A: The below diagram shows the demand and supply of insulin injection kits, when the price of insulin…
Q: With the help of appropriate diagrams, explain how each of these situations will affect the demand…
A: Demand curve in the health care sector depicts consumer's willingness to pay for medical care…
Q: If both coffee and tea are normal goods and the price of coffee increases, it will increase the…
A: In case of normal goods, the law of demand applies which states that as price of the given good…
Q: Draw a demand curve and label it D1. On the graph, illustrate an increase in demand and a decrease…
A: Demand analysis is important in economics in order to arrive at equilibrium point where the forces…
Q: 1. The movement from point A to point B on the graph is caused by a. an increase in price. b.…
A: Demand is made of different combinations of price and quantity demanded.
Q: 21. Correctly label the x-axis and y-axis with the terms price and quantity. 22. Assign values for…
A: Demand curve shows the Graphical relationship between the price and quantity demanded.
Q: Draw a demand curve for cars. What happens to it in each of the following scenarios? Why? 1. Car…
A: The demand curve shows the relationship between quantity demanded and the price of the good. The law…
Q: 21. Comrectly label the x-axis and y-axis with the terms price and quantity. 22. Assign values for…
A: A demand curve is a graphical representation of the price and quantity demanded. The demand curve…
Q: Correctly label the x-axis and y-axis with the terms price and quantity. Assign values for price and…
A: Price (in $) Quantity 50 900 75 800 100 700 125 600 150 500 175 400 200 300 225 200…
Q: % change in the price of buffalo meat and what will be the % change in revenues going to those who…
A: The ed shows the %change in Qd to % change in P. The ed can be calculated by different methods:…
Q: At a pen price of € 2.28, the supplier agrees to produce 7,500 pens and the demand for pens is…
A: Price and quantity are balance when they both are at the equilibrium point where S(x) = D(x) and…
Q: The market for good B is in equilibrium. Then a technological innovation reduces costs of production…
A: Equilibrium is the condition in which economic forces are perfectly balanced.
Q: demand curve for a kilo of cocaine ▼ remains unchanged shifts to the right shifts to the left
A: As per ‘law of demand’ other factors remain constant(cetris peribus) with the increase(↑) in…
Q: The graph below shows the daily demand for entry into the downtown core of a major city by commuter…
A: Hello, thank you for the question. Since there are multiple subpart questions posted here, only the…
Q: For the demand equation below, x represents the quantity demanded in units of 1000 and p is the unit…
A: For the demand equation below, x represents the quantity demanded in units of 1000 and p is the unit…
Q: The following table shows the monthly demand and supply in the market for ice cream in Denver. Price…
A: Equilibrium Arises when the Demand and Supply is equal.
Q: Suppose the supply and demand for wallets is given by the following equations: Demand: P 49.75 -…
A: Equilibrium in the market occurs where quantity demanded equals quantity supplied.
Q: Which of the following statements is true if the price is $10 in the graph above? Question 9…
A: since you have asked multiple questions and according to policy we can solve only 1 question and for…
Q: The diagram below shows the market for Good X. Which of the following could cause the shift in the…
A: Demand curve shows the relationship between price and quantity demanded. And as this relationship is…
Q: If the price of rice per Kg increases from Rs 200 to Rs 300, the quantity demand reduced from 10 Kg…
A: Answer to the question is as follows :
Q: Graphically, the equilibrium quantity can be identified as the: SELECT THE CORRECT ANSWER…
A: The equilibrium quantity: The equilibrium quantity will occur at the point where the demand curve…
Q: Plot the following Price and Quantity combinations: (4, 8), (1, 2), (5, 10) Is your graph more…
A: According to the Bartleby rules, we can answer only the first question from the multiple questions…
Q: The following is a copy of the equations from Question 1: Supply : Q = - 30,000 + 200,000P Demand :…
A: In a market, equilibrium occurs when the demand for goods and services equals the supply of goods…
Q: Question 20 Use the following graph to answer questions 20–25. For the graph…
A: Question 20 The answer is - d) None of the above represents a change in the quantity demanded with…
Q: The following table shows the quantity supplied and quantity demanded of a good at certain unit…
A: The quantity of good demanded by a consumer at a particular price gives the demand function and the…
Q: What is the type of good if demand increased from 25 to 37 as income increased from 1,500 to 2,000…
A: A good is considered to be normal if the income elasticity is greater than 0. For normal goods,…
Q: Using the supply and demand functions below, derive the demand and supply curves if Y=$55,000 and…
A:
Q: Using the supply and demand functions below, derive the demand and supply curves if Y = $55,000 and…
A: here we can solve the equilibrium price and quantity which are as follow- we know at equilibrium…
Q: Name a normal good, an inferior good, a set of substitute goods, a set of complements that are used…
A: "Since you have asked a question with multiple sub-parts, we will solve the first three sub-parts…
Q: What is wrong with this statement? Demand refers to the willingness of buyers to purchase different…
A: There is a small correction in the statement.
Q: What effect will each of the following have on the demand for small automobiles such as the Honda…
A: The demand for a good refers to the quantity demanded of a good at all prices. The demand curve is a…
Q: For the normal good, make a (Hypothetical) linear demand schedule with 7 different price points and…
A: Demand schedule is a tabular representation that shows the amount of commodities demanded at…
Q: Given the demand function for beef is Qx= 300-10 0Px+60Pp+0.01Y, where Qx is the tons of beef…
A: Given The demand function for beef QD = 300 - 100PX +60PP + 0.01Y Where, Px is the price per pound…
Trending now
This is a popular solution!
Step by step
Solved in 2 steps
- Describe the mechanism by which supply creates its osi1 demand.What is the relationship between price elasticity and position on the demand curve? For example, as you move up the demand curve to higher prices and lower quantities, what happens lo the measured elasticity? How would you explain that?Would you expect supply to play a more significant role in determining the price of a basic necessity like food or a luxury like perfume? Explain. Hint: Think about how the price elasticity of demand will differ between necessities and luxuries.
- Suppose both of these events took place at the same time. Combine your analyses of the impacts of the iPod and the tariff Induction to determine the likely impact on the equilibrium price and quantity of Sony Walkman-type products. Shaw your answer graphically.Qd= 100-2D +3Z Qs= 50+3D + 40B Z=5, B=1 a. equilibrium price and equilibrium quantitiy b. if income increases what happens to the equilibrium price and equilibrium quantity?Yousuf is going to market on 8.4.2021 with 10 OMR and he purchases 5 kilograms of the product which is 2 OMR per kilogram. When he went the next day with 20 OMR the price did not change and he purchased 10 kilograms of the product. The change in demand here discussed here is ________. a. Downward movement of supplier on the supply curve b. Upward movement of the supplier on the supply curve c. Rightward shift of the consumer on the demand curve d. Leftward shift of the consumer on the demand curve
- Q8- Suppose the quantity demanded weekly of the Super Titan radical tires is related to its unit price by equation p+x^2=241, where p is measured in dollars and x is measured in units of a thousand. How fast is the quantity demanded changing when x= 13, p= 72, and the price/tire is increasing at the rate of $7/ week? Round the answer to the nearest integer. Dropping at the rate of _______ tires/wkNational enegry security: Demand for oil (d): Qd = 60 - P Domestic supply of oil (Sd): QS = -30 + 2P (a) Calculate the self-sufficiency or autarky solution (P3, QS3 = QD5, imports = 0) in the figure above. How much is TNB? Answer: Area of triangle EFH. Graph it. Hint: Set demand = Supply and solve for the equilibrium price and quantity. You need the vertical intercept for demand and for supply to calculate CNB and PNB or TNB. Can you graph it? TNB =EFH? (b) Suppose the world price is given at Sf0 = P0 = $8. Calculate the inefficient open market allocation (P0, QD5, imports = QD5 - QS1). . How much isTNB? Graph it. Hint: plug the world price into the supply and demand equations and calculate imports for this solution (c) Suppose the World price + VP is given at Sf1 = P1 = P0 + VP= $9. Calculate the Efficient allocation (with vulnerability premium) (P1, QD4, imports = QD4 - QS2). TNB? Graph it. Hint: plug the world price + VP into the supply and demand equations. How…QXd = 14 - 0.5PX and QXs = 0.25PX - 1 a. Determine the equilibrium price and quantity. Show the equilibrium graphically. b. Suppose a $12 excise tax is imposed on the good. Determine the new equilibrium price and quantity (see video on inverse functions).
- You are an economist. Your friend started a new business selling masks. She asked for your help in making some important decisions. From the data obtained from her, you computed the Price Elasticity of Demand (PED) of Masks, and found absolute PED in February was 1.86, and since then the absolute PED of Masks declined by 55% in June. (a) Based on the PED of June, you would advise your friend for an increase/decrease/unchanged in the price - (b) The market price of the mask in July was Tk20 per unit. The total revenue earned in July was Tk300. You received the data for August and observed that the price now in August is Tk28 per unit and the quantity of masks sold in August is 12 units. Calculate the absolute value of Price Elasticity of Demand (PED) for masks from July to August.5. Consider the demand function for good1, Q1 = 2037 - 9P1 + 0.6000000000000001P2 - 0.75P3 + 0.07Y Where, price of good1 (P1) is 59, price of good2 (P2) is 255, price of good3 (P3) is 195, and income (Y) is 24425; (a) Find the price elasticity of demand (PED). **Don't forget to consider taking absolute value!** (b) Find the income elasticity of demand (YED). (c) Find the cross-price elasticity of demand (XED) between good1 and good3. (d) Estimate the percentage change in the demand for good1 resulting from a 4% decrease in the price of good2. (e) Based on the value of YED, comment on the nature/type of the goods ( answer in one word ) (f) Based on the value of the XED between good 1 and good3, comment on the relationship between these two goods ( answer in one word)Qno5: The price of a dress becomes AED 5,000 after a decrease of 20%. What was the original price of the dress? Round your answer to a whole number, if necessary. AED 1,000 AED 6,000 AED 5,020 AED 6,250