Suppose now that country's national income increases to $35 billion. Assuming the amount paid in taxes is fixed at $12 billion and MPC = 0.7, what will be the new household consumption? O $21.6 billion O $22.3 billion O $23.7 billion O $19.5 billion
Suppose now that country's national income increases to $35 billion. Assuming the amount paid in taxes is fixed at $12 billion and MPC = 0.7, what will be the new household consumption? O $21.6 billion O $22.3 billion O $23.7 billion O $19.5 billion

Chapter18: The Keynesian Model
Section: Chapter Questions
Problem 6SQ

Related questions
Question
100%
Need help with this, please show me where to plot the two points on the graph as well. Thanks!
Transcribed Image Text:Suppose now that country's national income increases to $35 billion. Assuming the amount paid in taxes is fixed at $12 billion and MPC = 0.7, what will
be the new household consumption?
O $21.6 billion
O $22.3 billion
O $23.7 billion.
O $19.5 billion
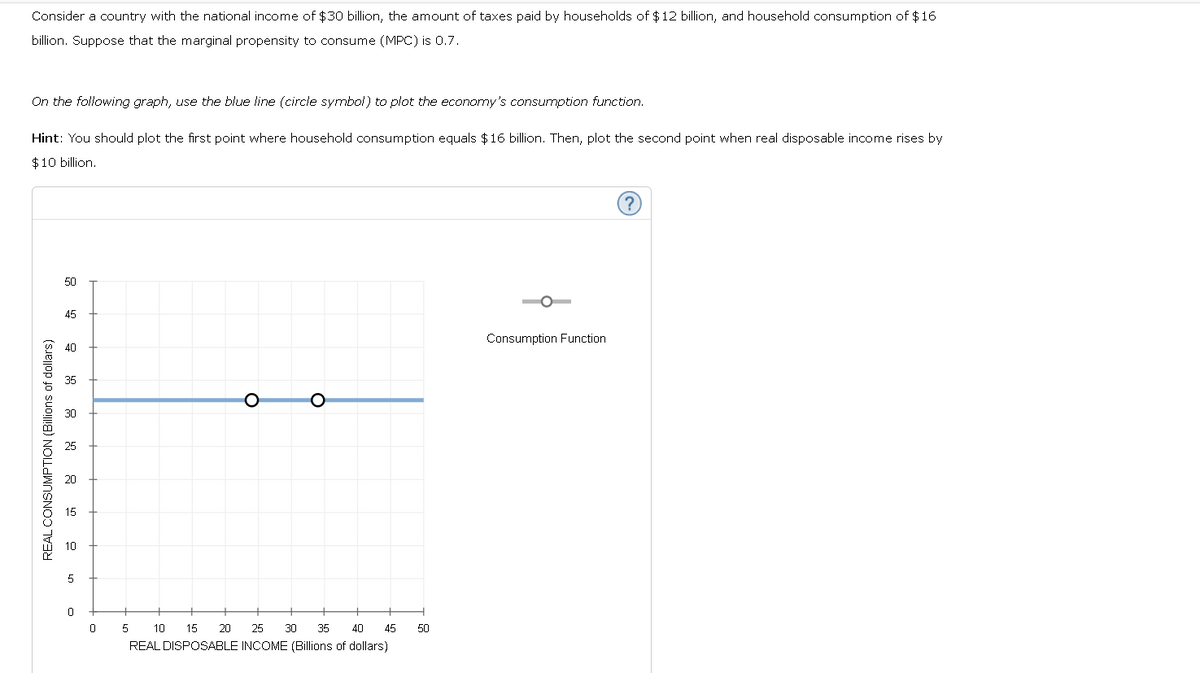
Transcribed Image Text:Consider a country with the national income of $30 billion, the amount of taxes paid by households of $12 billion, and household consumption of $16
billion. Suppose that the marginal propensity to consume (MPC) is 0.7.
On the following graph, use the blue line (circle symbol) to plot the economy's consumption function.
Hint: You should plot the first point where household consumption equals $16 billion. Then, plot the second point when real disposable income rises by
$10 billion.
REAL CONSUMPTION (Billions of dollars)
50
45
40
10
5
0
0
O
O
25 30 35
5 10 15 20
40 45
REAL DISPOSABLE INCOME (Billions of dollars)
50
Consumption Function
Expert Solution
This question has been solved!
Explore an expertly crafted, step-by-step solution for a thorough understanding of key concepts.

This is a popular solution!

Trending now
This is a popular solution!

Step by step
Solved in 4 steps with 3 images

Knowledge Booster


Learn more about
Need a deep-dive on the concept behind this application? Look no further. Learn more about this topic, economics and related others by exploring similar questions and additional content below.Recommended textbooks for you


Economics (MindTap Course List)
Economics
ISBN:
9781337617383
Author:
Roger A. Arnold
Publisher:
Cengage Learning

